Download PDF
Download page Gage Weights.
Gage Weights
Many watersheds are large enough that they contain multiple precipitation gages, especially in urban areas. An important question is immediately presented: How should the information at each gage be used to compute MAP over the watershed? A common approach is to take a fraction of the precipitation that occurs at each gage in order to compute MAP. The user-specified gage weights method provides a great deal of flexibility for the user to specify fractions using a generalized weighting scheme.
Basic Concepts and Equations
The required watershed precipitation depth can be inferred from the depths at gages using an averaging scheme. Thus:
| $P_{\mathrm{MAP}}=\frac{\sum_{I}\left(w_{i} \sum_{t} p_{i}(t)\right)}{\sum_{i} w_{i}}$ |
where PMAP = total storm MAP over the subbasin; pi(t) = precipitation depth measured at time t at gage i; and wi = weighting factor assigned to gage i. If gage i is not a recording device, the quantity \sum p_{i} (t) is replaced by the total storm depth entered by the user. Many techniques have been developed for computing the gage weighting factors for a subbasin; some of them are described in the next section on estimating parameters.
Problems can occur when interpolating precipitation over a large subbasin. For many reasons, the mean annual precipitation is likely to vary as a result of regional meteorological trends. When the variation is significant, the techniques presented previously for estimating depth factors must be modified. Consider the case where a precipitation gage has a mean annual precipitation depth of 76 cm. A subbasin in a study may be closer to that gage than to any other, but the subbasin may have an estimated annual precipitation of 88 cm. This suggests that on average, if 1 cm of precipitation is measured at the gage, that slightly more precipitation should be applied over the subbasin. The index precipitation can be used to correct for this situation.
The index precipitation for the gage and subbasin are applied together, by adjusting the gage data before it is used with the MAP factors to calculate the MAP for the subbasin. The precipitation gage data is then computed as:
| $P_{M A P}=\frac{\sum_{i}\left(\frac{I_{s u b}}{I_{i}} w_{i} \sum_{t} p_{i}(t)\right)}{\sum_{i} w_{i}}$ |
where PMAP = total storm MAP for the subbasin; pi(t) = precipitation depth measured at time t at gage i; Isub is the index precipitation for the subbasin; Ii is the index precipitation for the gage. As before, if gage i is not a recording device, the quantity \sum p_{i} (t) is replaced by the total storm depth entered by the user. The index precipitation for a gage is usually estimated as the mean annual precipitation computed from the historical records at the gage. Another logical choice is to use the mean spring precipitation if the study goal is to produce a watershed model that works well only in spring months. However, there is no rule that requires the index precipitation to be the mean precipitation, whether for a year, a season, or a month. The index precipitation can be used carefully to apply a user-selected ratio of the measured precipitation to each subbasin.
While the mean annual precipitation can be estimated for a gage using the historical record, it can be difficult to estimate for a subbasin. Typically regional information on precipitation patterns must be used. One example of generally available data for estimating the annual precipitation for a subbasin is the PRISM data set (Daly, Neilson, and Phillips, 1994).
The time-series data recorded at each gage implicitly includes both volume and timing of the precipitation. In some cases it may be desirable to change the volume for a gage without changing the timing. This may be necessary if high winds during the storm cause the gage to under-catch precipitation and consequently under estimate the actual precipitation. Specifying the total storm depth for a recording gage is always optional. When a total storm depth is included, the precipitation gage data is then computed as:
| $P_{M A P}=\frac{\sum_{i}\left(\frac{D_{m \text { measured }}}{D_{\text {option }}} \frac{I_{\text {sub }}}{I_{i}} w_{i} \sum_{t} p_{i}(t)\right)}{\sum_{i} w_{i}}$ |
where PMAP = total storm MAP for the subbasin; pi(t) = precipitation depth measured at time t at gage i; Isub is the index precipitation for the subbasin; Ii is the index precipitation for the gage, Dmeasure is the total depth measured at the gage, Doption is the optionally specified total storm depth. For a non-recording gage, Dmeasure is automatically equal to Doption.
After the mean areal precipitation is computed, it must be distributed in time to create the hyetograph for a subbasin. A second weighting process is used to establish the temporal pattern using only recording gages. The weighting process includes a scheme to bias in favor of gages reporting precipitation when more than once gage is used to establish the temporal pattern. The hyetograph is computed as:
| $p(t)=\frac{P_{M P}}{\sum_{i}\left(w_{i} \sum_{t} p_{i}(t)\right)} \sum_{i} w_{i} p_{i}(t)$ |
where PMAP = total storm MAP for the subbasin; pi(t) = precipitation depth measured at time t at gage i; wi is the temporal weight for gage i.
Parameter Estimation
This method requires a MAP weighting factor for each gage that will be used to compute a hyetograph for a subbasin. A separate temporal weighting factor is also required. The weights are determined and entered by the user; the program is not able to automatically estimate the weighting factors. The use of the index precipitation is optional. The following methods could be considered for estimating the weighting factors.
Arithmetic Mean MAP Factors
This method assigns a weight to each gage equal to the reciprocal of the total number of gages used for the MAP computation. Gages in or adjacent to the watershed can be selected.
Thiessen Polygon MAP Factors
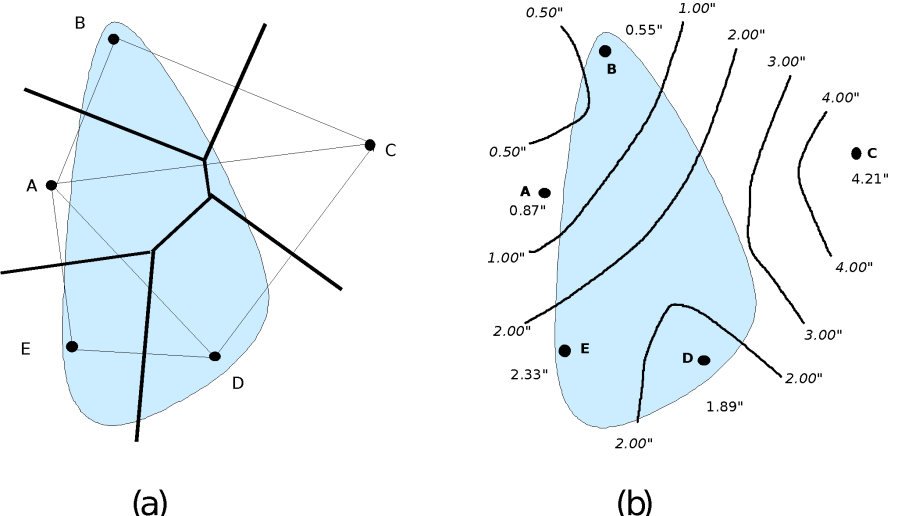
This is an area-based weighting scheme, predicated on an assumption that the precipitation depth at any point within a watershed is best estimated as the precipitation depth at the nearest gage to that point. Thus, it assigns a weight to each gage in proportion to the area of the watershed that is closest to each gage.
As illustrated in the figure (a) below, the gage nearest each point in the watershed may be found graphically by connecting the gages, and constructing perpendicular bisecting lines; these form the boundaries of polygons surrounding each gage. The area within each polygon is nearest the enclosed gage, so the weight assigned to the gage is the fraction of the total area that the polygon represents.
Details and examples of the procedure are presented in Chow, Maidment, and Mays (1988), Linsley, Koehler, and Paulus (1982), and most hydrology textbooks.
Isohyetal Line MAP Factors
This is also an area-based weighting scheme. Contour lines of equal precipitation are estimated from the point measurements, as illustrated by the figure (b) below. This allows a user to exercise judgment and knowledge of a basin while constructing the contour map. MAP is estimated by finding the average precipitation depth between each pair of contours (rather than precipitation at individual gages), and weighting these depths by the fraction of total area enclosed by the pair of contours. Again, details and examples of the procedure are presented in most hydrology textbooks.
Time Weighting Factors
If a single recording gage is used to establish the temporal pattern of the hyetograph, the resulting MAP hyetograph will have the same relative distribution as the one recording gage. For example, if the gage recorded 10% of the total precipitation in 30 minutes, the MAP hyetograph will have 10% of the MAP in the same 30-minute period.
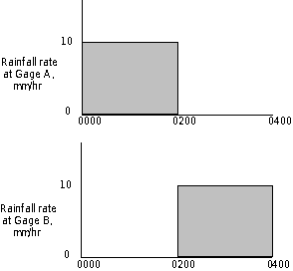
On the other hand, if two or more gages are used, the pattern will be a weighted average of the pattern observed at those gages. Consequently, if the temporal distribution at those gages is significantly different, as it might be with a moving storm, the average pattern may obscure information about the precipitation on the subbasin. This is illustrated by the temporal distributions shown in the figure below. Here, hyetographs of rainfall at two gages are shown. At gage A, rain fell at a uniform rate of 10 mm/hr from 00:00 hours until 02:00 hours. No rain was measured at gage A after 02:00. At gage B, no rain was observed until 02:00, and then rainfall at a uniform rate of 10 mm/hr was observed until 04:00. The likely pattern is that the storm moved across the subbasin from gage A toward gage B. If these gage data are used with Equations 4 and 5 to compute an average pattern, weighting each gage equally, the result is a uniform rate of 5 mm/hr from 0:000 until 04:00. This may fail to appropriately represent the temporal distribution and intensity of the storm. A better scheme might be to select one of the gages as a pattern for the watershed average.
