Download PDF
Download page Hypothetical Storm.
Hypothetical Storm
The Hypothetical Storm method is a flexible and generalized modeling method for modeling idealized storms. The hypothetical storm is often used for design or risk analysis or may represent simplified versions of real storms with desirable properties. The user has full control over the storm temporal pattern and spatial distribution (including the point-to-area conversion) and can be used directly with precipitation-frequency products such as NOAA Atlas 14.
There are effectively three sub-types of the Hypothetical Storm: Area-Dependent Pattern, SCS, and a highly flexible User-Specified Pattern.
The Hypothetical Storm method subsumes the SCS Storm method, which was available in HEC-HMS version 4.2.1 and prior versions.
User-Specified Pattern
This method is the most generalized, and is the most common and recommended hypothetical storm method due to its flexibility. This method creates a synthetic storm based on a single storm duration and recurrence interval (i.e. frequency of exceedance).
Parameter Estimation
The parameters that must be defined are the rainfall depth(s), temporal pattern, storm duration, storm area, point-to-area reduction, and spatial distribution. The spatial distribution may be uniform for all subbasins in the basin model or may be variable by each subbasin.
Depth
The rainfall depth for the storm may be entered as a point depth or by reading from a precipitation-frequency grid. These represent cumulative depths for a specified frequency and rainfall duration, such as the 0.01 annual exceedance probability (AEP) 72-hour storm depth. In both options, the rainfall depth typically represents a point estimate. In real storms, rainfall intensity decreases with increasing storm area.
In the United States, depths for various durations can be obtained from a variety of sources. Currently, the best available product is NOAA Atlas 14, which provides precipitation-frequency estimates for most regions of the United States, separated into individual volumes. These data can be accessed from the NOAA Precipitation Frequency Data Server (https://hdsc.nws.noaa.gov/pfds/). In addition to NOAA Atlas 14, several products are available for the entire country, including TP-40 (Herschfield, 1961) for durations from 30 minutes to 24 hours and TP-49 (Miller, 1964) for durations from 2 to 10 days. The Eastern part of the country has extra data for short durations in HYDRO-35 (Fredrick, Myers, and Auciello, 1977). Some locations have specialized data developed locally, for example the Midwest has available Bulletin 71 (Huff and Angel, 1992). More recent site- or project-specific regional precipitation-frequency studies are becoming more common. These various reports are all similar in that they contain maps with isopluvial lines of constant precipitation depth. Each map is labeled with an annual exceedance probability and storm duration. Knowing the location of the watershed on the map, the depth for each required duration and exceedance probability can be interpolated between the isopluvial lines.
Areal Reduction
To account for the decrease in rainfall intensity over a larger area, a point-to-area conversion, also called an areal reduction factor (ARF), must be applied, except for very small watershed areas. The underlying reason for areal reduction is that precipitation averaged over an area is less than a point maximum. This is especially important for larger watersheds.
The storm area should be set equal to the drainage area at the evaluation location. The evaluation location will be where the flow estimate is needed, for example at the inflow to a reservoir or at a particular river station where a flood damage reduction measure is being designed. When there are several evaluation locations in a watershed, separate storms must be prepared for each location. Failure to set the storm area equal to the drainage area at the evaluation location leads to incorrect depth-area adjustments and either over or underestimation of the flow for a particular exceedance probability.
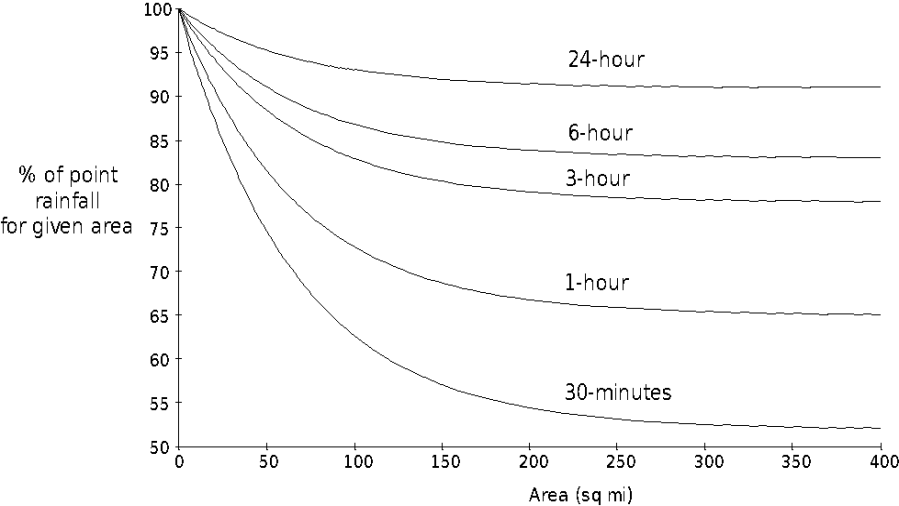
Area reduction is an optional input to the Hypothetical Storm method, but in most cases should be used. The only exceptions are for very small study areas or if reduction factors have already been applied to the rainfall depths prior to input to HMS. Areal reduction factors apply a percentage to the point value. Precipitation-frequency products like NOAA Atlas 14 provide rainfall depths for a point maximum and must be adjusted to account for the reduction in intensity as storm area increases. In HMS, area reduction may be applied using TP-40/49 curves or by user entry. TP-40 is used for durations up to 24 hours, and TP-49 is used for durations longer than 24 hours. TP-40/49 should not be applied to watersheds (total study areas) larger than 400 square miles, as the curves are asymptotic at large areas.
TP-40/49 was developed using a limited set of data and may not be appropriate for all study locations. The preferred approach is to develop site- or region-specific areal reduction factors (ARFs) based on historical storm data. Depth-area-duration tables can be extracted from storm grids and used in the development of ARF estimates. ARFs estimated using historical data can then be entered to HMS as User-Specified.

Temporal Pattern
The storm pattern is a dimensionless representation of how the cumulative rainfall depth varies in time. The units of each axis of the pattern are in percent, from 0% to 100%, with the point (100,100) representing the total storm duration and the total accumulated rainfall depth.
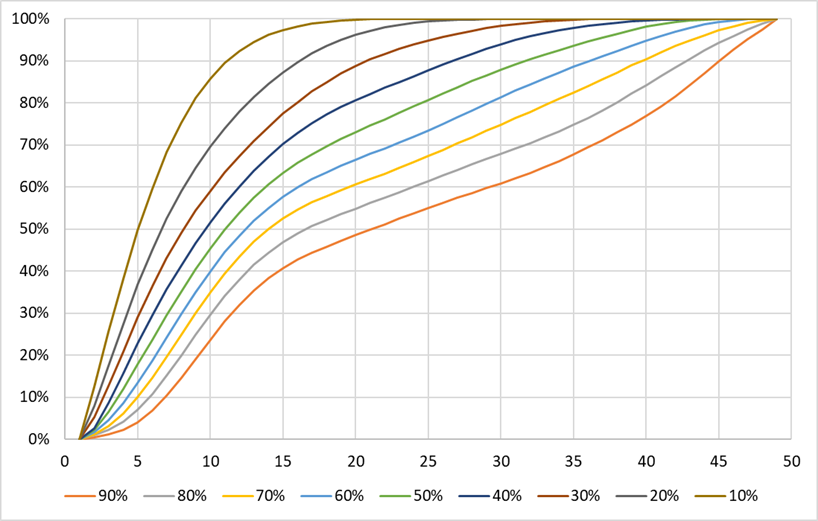
The temporal pattern can be derived from historical storms by accumulating the rainfall depth over each increment of time and standardizing the two axes. Temporal patterns are also available from NOAA Atlas 14 at the Precipitation Frequency Data Server as supplementary information. These patterns are based on probabilistic analyses of time patterns of heavy rainfall across the U.S. The patterns are classified by "quartile", which defines in which quarter the most volume of rainfall occurs, and by "percentile" which is a ranking of the peakedness of storms.

SCS Patterns
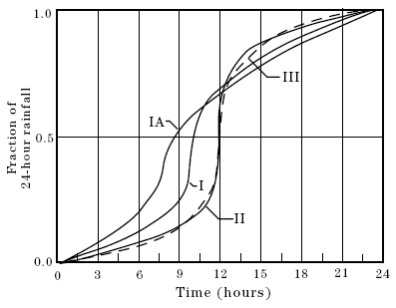
The SCS methods are based on hypothetical storms developed by the Soil Conservation Service (SCS), now known as the Natural Resources Conservation Service (NRCS). The SCS storms are legacy products that were used for drainage planning in the United States. These storms were developed by the SCS as averages of rainfall patterns; they are represented in a dimensionless form. There are four patterns: Type I, Type IA, Type II, and Type III.
Basic Concepts and Equations
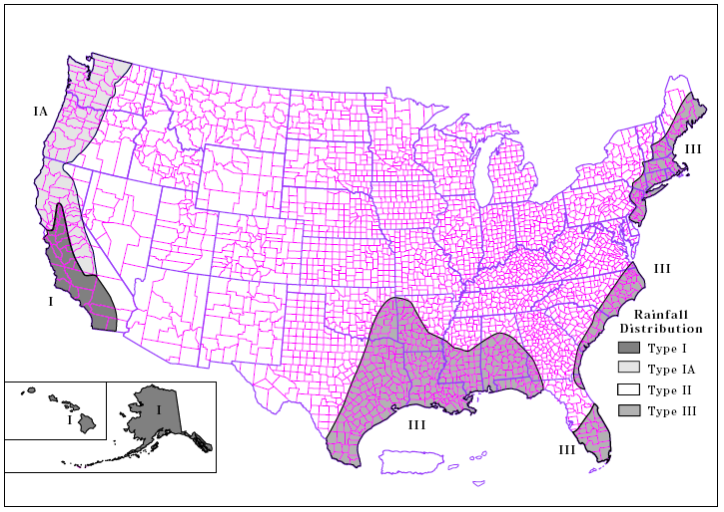
The SCS designed the storm for small drainage area of the type for which they usually provide assistance. The intended use is for estimating both peak flow rate and runoff volume from precipitation of a "critical" duration. Storm-producing mechanisms vary across the United States, so four different storm patterns were developed. The patterns and associated regions are shown in the figure below; the actual data values can be found separately (USDA, 1992). The Type I and Ia storms represent Pacific climates with generally wet winters and dry summers; these are used on the Pacific coast from Washington to California, plus Alaska and Hawaii. The Type III storm represents areas bordering the Gulf of Mexico and Atlantic seaboard where tropical storms and hurricanes generate heavy runoff. The Type II storm is used in the remainder of the United States. Storm types have not been defined for other locations in the world; a storm type may be selected based on similar weather patterns and comparisons of cumulative precipitation for typical storms.
The SCS storm is always 24 hours in duration.

Parameter Estimation
The storm type should be selected based on the location of the watershed after consulting the figure above. The boundaries are approximate, so engineering judgement may be used to select a storm type on the basis of the meteorologic patterns. The precipitation depth to be applied to the pattern can be selected from any of the sources discussed in the Frequency Storm section. Because the SCS storm method does not account for depth-area reduction or annual-partial duration conversion, the user must make these adjustments manually before entering a depth value.
Area-Dependent Pattern
This method is intended for use in combination with the Depth-Area Analysis compute method. The Depth-Area Analysis is designed to assist in the process of developing peak flows due to frequency precipitation for a single recurrence interval at multiple locations. Similar to the User-Specified Pattern, a storm duration, depth, point-to-area conversion, and spatial distribution is specified. The rainfall depths can be input manually or read in from frequency grids such as NOAA Atlas 14. The primary difference between this method and the User-Specified Pattern is that the dimensionless temporal pattern is variable by storm area. This allows for flexibility in the temporal distribution of the storm, such as allowing for higher rainfall intensity at smaller storm areas.
