Download PDF
Download page Precipitation Basic Concepts.
Precipitation Basic Concepts
Precipitation is the driving force behind all hydrologic processes. In the strict sense, precipitation includes rain, snow, ice, and every other form of water falling from the atmosphere and reaching the earth's surface. Without precipitation, there can be no infiltration, transpiration, surface runoff, baseflow, channel flow, or any other hydrologic process.
Mechanisms of Precipitation
While all precipitation involves some form of water falling from the atmosphere to the land surface, precipitation forms for a variety of reasons. Two principal mechanisms of precipitation are coalescence and cooling.
Coalescence
Under the coalescence mechanism, a water droplet forms around a nuclei when the temperature is below the dew point. The nuclei could be a dust particle, carbon dioxide, salt particle, or any other airborne non-water particle. As the amount of water coalesced in the droplet increases, the droplet falls at an increased velocity. The droplet will break apart when its diameter reaches approximately 7 mm. The pieces of the broken droplet can then form the nuclei of more droplets. Depending on wind conditions in the atmosphere, a droplet may grow and break apart many times before it finally reaches the ground.
Cooling
Under the cooling mechanism, precipitation occurs when the amount of moisture in the atmosphere exceeds the saturation capacity of air. Warm air can hold more water than cold air. If warm, moist air is cooled sufficiently, water in excess of the saturation capacity will fall as precipitation. Adiabatic cooling occurs when an air mass at a low elevation is lifted to a higher elevation. Frontal cooling happens along the border between a warm weather front and a cold front. Contact cooling is the result of warm air blowing across a cold lake. Finally, radiation cooling occurs when air is heated during the day and absorbs evaporated water, but then cools during the night. Any of the various cooling processes can lead to precipitation. Certain cooling processes may be more likely at some times of the year, and not all processes occur over every watershed.
Types of Precipitation
There are three different types of precipitation that are classified by the producing mechanism. The different types are closely related to weather patterns.
Convective
Convective precipitation occurs when warm, moist air rises in the atmosphere. Pressure decreases as elevation increases, which causes the temperature to fall. If the moist air mass rises to a sufficiently high elevation, precipitation will condense and fall. The tremendous energy associated with convection processes often leads to very intense precipitation rates. However, a convective storm usually has a small area and a short duration. Summer thunderstorms are the principal example of this type of precipitation.
Cyclonic
Cyclonic precipitation occurs when warm, moist air is drawn into a low-pressure cold front. The warm air rises as it is drawn into the low-pressure zone and is subjected to adiabatic cooling. The intensity of the precipitation is determined by the magnitude of the low-pressure system and the presence of a warm and moist air mass. Cyclonic storms tend to be large and have a light- to medium-intensity precipitation rate. Because of their large size, they tend to have a long duration. Most precipitation is the result of cyclonic activity.
Orographic
Orographic precipitation results when an air mass is lifted as it encounters topographic obstacles. A cold front is usually the driving force that pushes the air mass towards the obstacle, usually a mountain range. The moist air mass is mechanically lifted when the cold front forces it against a mountain range. The air mass is forced up in elevation where it cools adiabatically and precipitation results. It is important to realize that precipitation is not automatically orographic because the precipitation occurs over mountains. Orographic precipitation only results when the air mass moves perpendicular to the mountains. Within the United States, these storms are often found in the Cascade, Sierra Nevada, and Rocky mountains.
Measuring Precipitation
Accurately measuring precipitation is one of the greatest challenges in water resources engineering; the lack of measured precipitation may be a significant hurdle to hydrologic modeling. The complexity, accuracy, and robustness of a hydrologic model are meaningless if the precipitation boundary condition is incorrect. Precipitation can be measured at a point using some type of gage, or it can be measured spatially using a tool such as radar.
Point Measurements from Gages
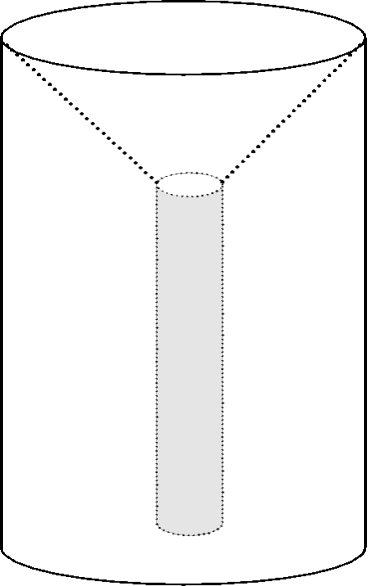
Each of the precipitation measuring devices described in the table below captures rainfall or snowfall in a storage container that is open to the atmosphere. The depth of the collected water is then observed, manually or automatically, and from those observations, the depth of precipitation at the location of the gage is obtained.
Precipitation field monitoring options (WMO, 1994)
Option | Categorization |
|---|---|
Manual (also referred to as non-recording, totalizer, or accumulator gage) | This gage is read by a human observer. An example is shown below. Often such gages are read daily, so detailed information about the short-term temporal distribution of the rainfall is not available. |
Automatic hydrometeorological observation station | This type of gage observes and records precipitation automatically. An example is a weighing gage with a strip-chart data logger. With this gage, the temporal distribution is known, as a continuous time record is available. In the HEC-HMS, a gage at which the temporal distribution is known is referred to as a recording gage. |
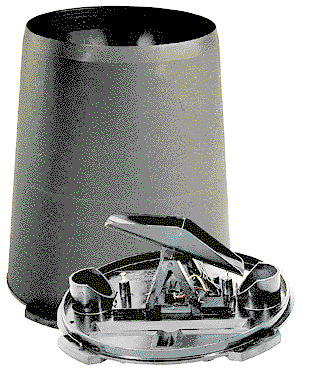
Telemetering hydrometeorological observation station | This type of gage observes and transmits precipitation depth automatically, but does not store it locally. An example is an ALERT system tipping bucket raingage with UHF radio transmitter. Telemetering gages are typically recording gages. An example is shown below. |
Telemetering automatic hydrometeorological observation station | This type of gage observes, records, and transmits automatically. It is a recording gage. |


Areal Measurements from Radar
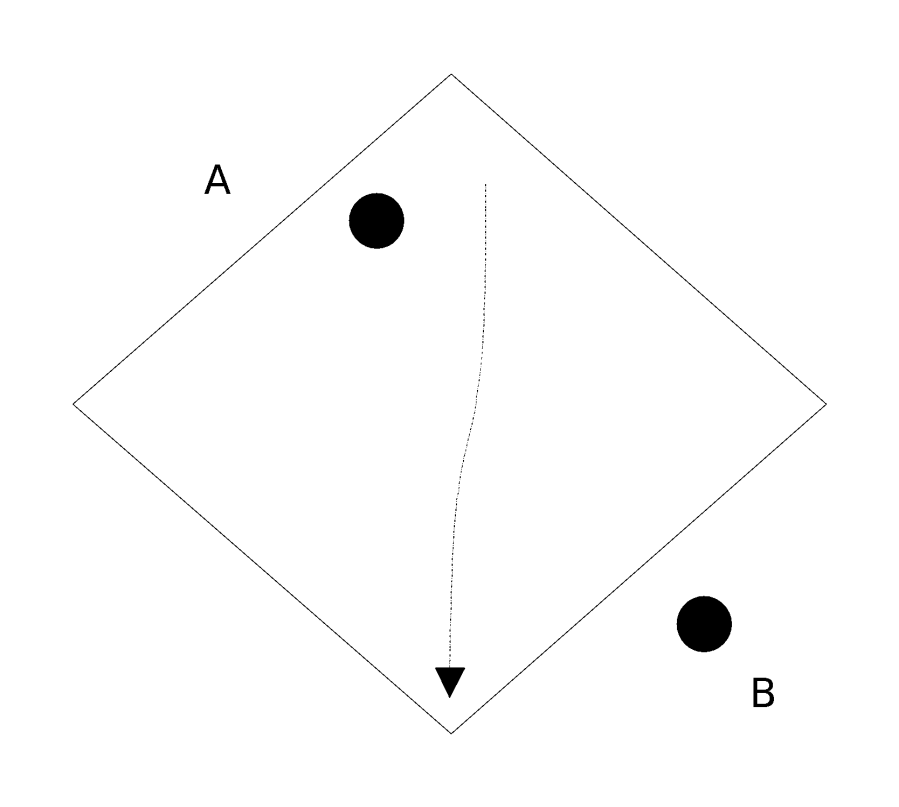
The figure below shows a typical (but very simple) situation. Runoff is to be predicted for the watershed shown. Rainfall depths are measured at reporting gages A and B near the watershed.
From the gaged data, one might estimate mean areal precipitation (MAP) as a weighted average of the depths observed. The weights assigned might depend, for example, on how far the gage is from one or more user-specified index points in the watershed. In this example, if an index point at the centroid of the watershed is selected, then the weights will be approximately equal, so the MAP will equal the arithmetic average of the depths observed at gages A and B.
The MAP estimated from the gage network in this manner is a good representation of rainfall on a watershed if the raingage network is adequately dense in the vicinity of the storm. The gages near the storm must also be in operation, and must not be subject to inadvertent inconsistencies (Curtis and Burnash, 1996).
The National Weather Service provides guidelines on the density of a raingage network. These suggest that the minimum number of raingages, N, for a local flood warning network is:
| 1) | N=A^{0.33} |
in which A = area in square miles. However, even with this network of more than the minimum number of gages, not all storms may be adequately measured. Precipitation gages such as those illustrated in the figures previously are typically 8-12 inches (20-30 cm) in diameter. Thus, in a one sq-mi (2.6 km2) watershed, the catch surface of the gage represents a sample of precipitation on approximately 1/100,000,000th of the total watershed area. With this small sample size, isolated storms may not be measured well if the storm cells are located over areas in which "holes" exist in the gage network or if the precipitation is not truly uniform over the watershed.
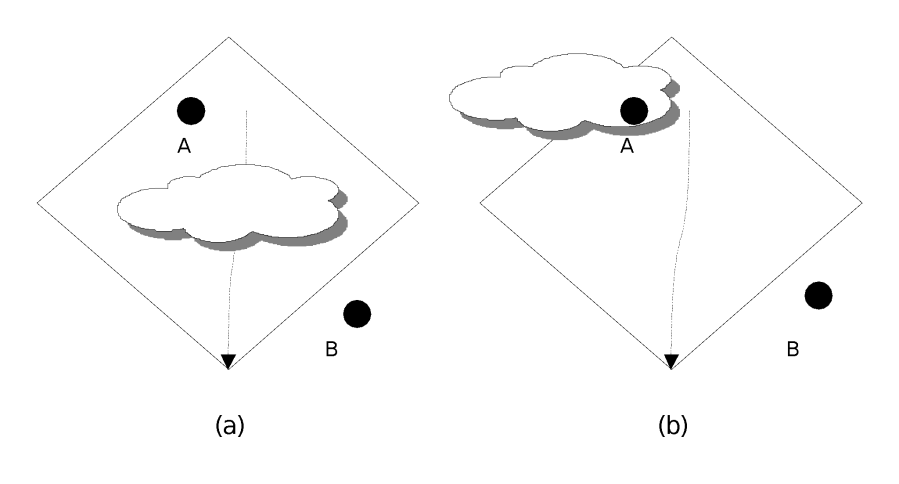
The impact of these "holes" is illustrated by the figure below. Figure (a) shows the watershed from the figure above, but with a storm superimposed. In this case, observations at gages A and B would not represent well the rainfall because of the areal distribution of the rainfall field. The "true" MAP likely would exceed the MAP computed as an average of the observations. In that case, the runoff would be under-predicted. Similarly, the gage observations do not represent well the true rainfall in the case shown in Figure (b). There, the storm cell is over gage A, but because of the location of the gage, it is not a good sampler of rainfall for this watershed. Thus, in the second case the runoff might be over-predicted.
One potential solution to the problem of holes in the rainfall observations is to increase the number of gages in the network. But even as the number of gages is increased, one cannot be assured of measuring adequately the rainfall for all storm events. Unless the distance between gages is less than the principal dimension of a typical storm cell, the rainfall on a watershed may be improperly estimated. A second solution is to use of rainfall depth estimates from weather radar.
The WMO Guide to Hydrological Practices (1994) explains that
Radar permits the observation of the location and movement of areas of precipitation, and certain types of radar equipment can yield estimates of rainfall rates over areas within range of the radar.
Weather radar data are available from National Weather Service (NWS) Weather Surveillance Radar Doppler units (WSR-88D) throughout much of the United States. Each of these units provides coverage of a 230-km-radius circular area. The WSR-88D radar transmits an S-band signal that is reflected when it encounters a raindrop or another obstacle in the atmosphere. The power of the reflected signal, which is commonly expressed in terms of reflectivity, is measured at the transmitter during 360º azimuthal scans, centered at the radar unit. Over a 5- to 10-minute period, successive scans are made with 0.5º increments in elevation. The reflectivity observations from these scans are integrated over time and space to yield estimates of particle size and density in an atmospheric column over a particular location. Varying levels of analysis may be performed to check and correct inconsistencies in the measured data. The final data products are distributed in a variety of digital formats. Grid cells are typically on the order of 4 km by 4 km.
Program Data Requirements
This chapter provides details of the models for computing surface runoff from precipitation: the alternatives are various forms of the unit-hydrograph methods, and the kinematic-wave method. Inherent in methods of both types is an assumption that the precipitation is distributed uniformly over the watershed for a given time duration. This, in turn, requires specifying the properties of this uniform rainfall. In the program, these properties include (1) the total depth of the watershed precipitation, and (2) the temporal distribution of that precipitation. Most of the precipitation methods included in the program compute a precipitation hyetograph for all of the subbasins in a basin model. The hyetograph is a time-series of precipitation, so it includes both the depth and timing of the precipitation. Note that the hyetograph represents a mean precipitation condition over the subbasin. The gridded precipitation method is an exception; it computes grids of precipitation over each subbasin instead of a hyetograph. Even so, the gridded precipitation is essentially a hyetograph for each grid cell.