Download PDF
Download page Viewing Results for an Analysis.
Viewing Results for an Analysis
A variety of graphical and tabular results are available after an uncertainty analysis is computed. The program tracks all of the data in the uncertainty analysis, the selected basin model, and the selected meteorologic model. It also tracks any time-series data, paired data, or grid data used in the basin and meteorologic models. Results for an uncertainty analysis can only be accessed when none of this data has changed since the last time the analysis was computed. If any of the data has changed, you will need to recompute the uncertainty analysis before you will be allowed to start accessing results.
Once a result is open for viewing it will remain open until it is closed by the user. It is possible that data used during the simulation that produced the result could change while the result is open for viewing. In this case, the open result will immediately show an indication that data has changed and the uncertainty analysis needs to be recomputed. After the analysis is recomputed the open results are automatically updated with the new results and the indication is updated with the date and time of the most-recent compute.
Sampled Parameters
The uncertainty analysis includes a number of parameters that are sampled during the simulation. A new parameter value is sampled for each sample of the simulation. The sequence of sampled values from the first sample to the last sample is stored separately for each parameter and may be viewed in a table. Each parameter sample can be accessed by clicking the "Parameter" node on the "Results" tab of the Watershed Explorer (Figure 1). The parameter sample table will open. The table includes one row for each sample of the simulation. The first column of the table displays the sample number while the second column displays the sampled parameter value. An example of a parameter sample is shown in Figure 2.


Individual Elements
The uncertainty analysis may include one or more locations where output results have been selected. Special tabular and graphical results may be viewed when outflow or pool elevation is selected. The element outflow is available at all seven element types including subbasin, reach, junction, source, diversion, reservoir, and sink. The pool elevation is only available at reservoir elements where the storage is specified with an elevation-storage or elevation-area curve. Other computed time-series may be selected and will be stored in the uncertainty analysis output HEC-DSS file. These other computed time-series may be viewed and analyzed using the HEC-DSSVue software.
Two different tables are available when outflow is selected for a location. The first table displays the maximum outflow for each sample of the uncertainty analysis. The second table displays the outflow volume for each sample. The tables can be accessed by expanding the element node on the "Results" tab of the Watershed Explorer (Figure 3) and clicking on the result node. The selected table will open. Each table includes one row for each sample of the simulation. The first column of the table displays the sample number while the second column displays either the maximum outflow or the outflow volume. An example of the outflow volume table is shown in Figure 4.


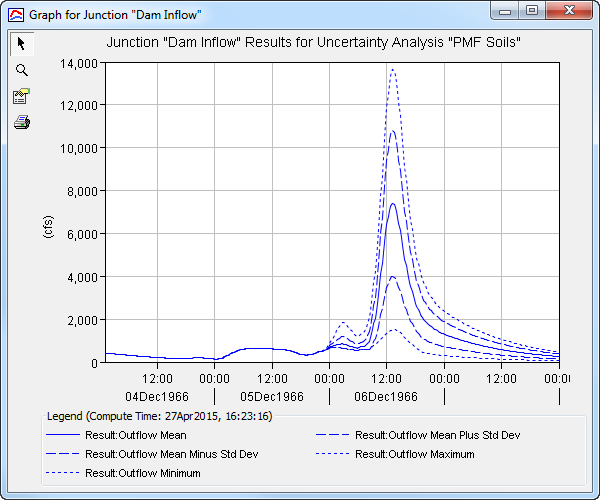
An outflow graph is also available when outflow is selected for a location. The graph represents a statistical analysis of the outflow time-series computed for each sample of the simulation. The minimum and maximum value across all samples is determined for each interval of the simulation time window. Additionally, the mean and standard deviation are computed for each time interval. The graph presents the data as the mean, mean plus the standard deviation, mean minus the standard deviation, maximum, and minimum. An example graph is shown in Figure 5. The graph can be accessed by clicking on the node under the selected element location.
A table and a graph are available when pool elevation is selected for a reservoir location. The table displays the maximum pool elevation for each sample of the uncertainty analysis. The first column of the table displays the sample number while the second column shows the maximum pool elevation. The table can be accessed by expanding the reservoir node in the Watershed Explorer and clicking on the result node in the same way described above for accessing outflow results. An example of a maximum pool elevation table is shown in Figure 6.

The pool elevation graph represents a statistical analysis of the pool elevation time-series computed for each sample of the simulation. The analysis is presented as the mean pool elevation, mean plus the standard deviation, mean minus the standard deviation, maximum, and minimum for each time interval of the simulation. The graph can be accessed by clicking on the node under the selected reservoir location. An example of a pool elevation graph is shown in Figure 7.
