Download PDF
Download page Viewing Results for the Current Analysis.
Viewing Results for the Current Analysis
A variety of graphical and tabular results are available after a depth-area analysis is computed. The same results are also available for the current analysis, so long as no data used in the analysis has changed. The program tracks all of the data in the depth-area analysis and selected basin model and meteorologic model on which it is based. It further tracks all of the data used in the basin model and meteorologic model that is the basis of the depth-area analysis. Results for a depth-area analysis are only available when none of this data has changed since the last time the analysis was computed. If any of the data has changed, you will need to recompute the depth-area analysis before you will be allowed to view results.
Once a result is open for viewing it will remain open until it is closed by the user. It is possible that data or model information used by the analysis that produced the result could change while the result is open for viewing. In this case, the open result will immediately show an indication that data has changed and the depth-area analysis needs to be recomputed. After the depth-area analysis is recomputed the open results are automatically updated with the new results and the indication is updated with the data and time of the most-recent compute.
Peak Flow Summary Table
The peak flow summary table shows certain information such as the depth-area analysis name, underlying basin model and meteorologic model names, and information about the time window. The principal information is a table that includes one row for each analysis point. Columns are provided that give the name of the analysis point, drainage area, peak flow, and time of peak flow. The data is obtained by extracting results from the simulation that is performed for each analysis point. The peak flow summary table is accessed from the Results menu. When the Basin Map is open and a depth-area analysis is selected, choose the Peak Flow Summary command to view the results. Sample results are shown in Figure 1.
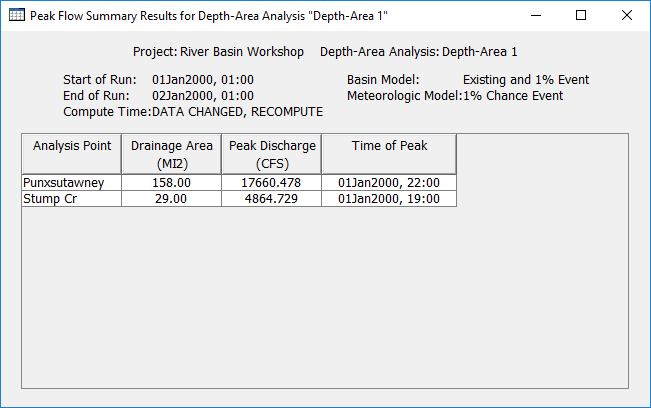
Figure 1. Peak flow summary table showing the computed peak flow for each analysis point. Results correspond to the frequency storm with an area matched to the drainage area.
Individual Elements
There are three ways to access results for individual elements in the current depth-area analysis. All methods show the same results. You must select one or more elements in the basin map before you can view results for that element. However, not all elements in the basin map may have results. The depth-area analysis is based on a basin model and a meteorologic model. The depth-area analysis works with selected analysis points. The results are separate for each analysis point. Results for an analysis point are only computed at the elements upstream of that analysis point; all other elements in the basin model will have no results for that analysis point. When an element is upstream of more than one analysis point, you will need to indicate the analysis point for which results are desired.
The first method for viewing individual element results is to use the Results menu. You may need to first open the basin model by clicking on it in the Watershed Explorer, on the "Components" tab. The current depth-area analysis is shown in brackets in the basin map title bar. Choose the analysis point for which results will be viewed, by selecting from the Results | Select Point menu. The currently selected analysis point is shown in brackets in the menu. Next select one or more elements in the basin map by clicking with the arrow tool. With an element selected in the basin map, click the Results menu and select the Element Graph command, the Element Summary Table command, or the Element Time-Series Table command. The appropriate result will automatically be shown in the Desktop area. The information included in the graph (Figure 2) varies by element type, but always includes outflow. Optional items such as observed flow, computed stage, and observed stage are also included.
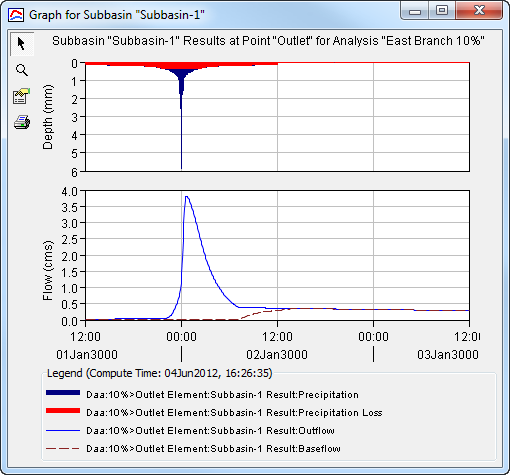
Figure 2. Element graph for a subbasin after a depth-area analysis.
The information included in the summary table (Figure 3) also varies by element type but always includes the peak flow, time of peak flow, and outflow volume. The time-series table (Figure 4) includes the same information as the graph but in numerical format. If you selected more than one element, then one result for each element will open. The menu commands on the Results menu will only be enabled if the results for the current depth-area analysis do not need to be recomputed, and an analysis point has been selected on the Results menu.
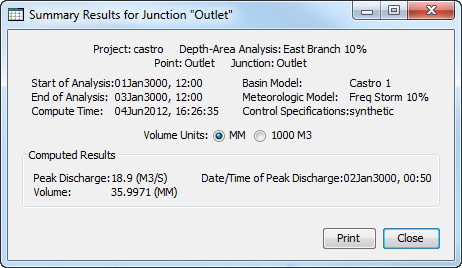
Figure 3. Element summary table for a junction after a depth-area analysis. The junction is also an analysis point.
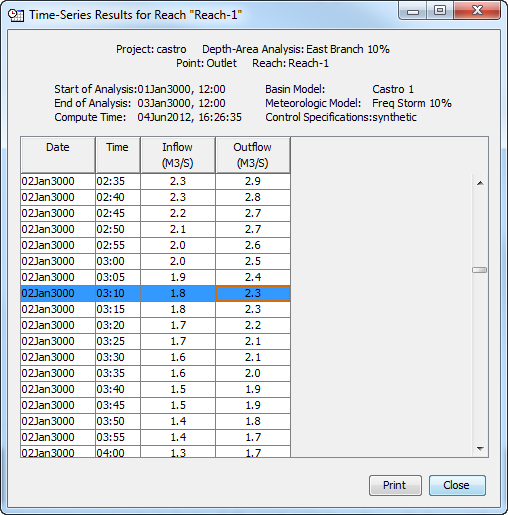
Figure 4. Element time-series table for a reach after a depth-area analysis.
The second method for viewing individual element results is to use the element icon in the basin map. Again you may need to open the basin model before attempting to view results. You may also need to choose the analysis point for which results will be viewed, by selecting from the Results | Select Point menu. Finally, click on an element to highlight it. Keep the mouse over the element and press the right mouse button. A context menu is displayed that contains several choices including View Results. The name of the current depth-area analysis is shown in brackets after the menu command. Move the mouse into the View Results submenu and select any of the result commands: Graph, Summary Table, or Time-Series Table. The appropriate result will open. If you selected more than one element, then one result will open for each element. The View Results menu command will only be enabled if the results for the current depth-area analysis do not need to be recomputed, and an analysis point has been selected on the Results menu.
The third method for viewing individual element results is to use the buttons on the toolbar. First you must open the basin model, select a current analysis point on the Results menu, and finally select one or more elements in the basin map by clicking with the arrow tool. Once you have a selected element, click the graph, summary table, or time-series table buttons. The button for selecting a graph shows a line plot. The button for the summary table shows a plain table. The button for the time-series table shows a table plus a clock. The appropriate result will automatically open. If you selected more than one element, then one result for each element will be added to the Desktop. The toolbar buttons for viewing element results will only be enabled if the results for the current depth-area analysis do not need to be recomputed, and there is an element selection in the basin map, and the selected element is upstream of the analysis point selected on the Results menu.