Download PDF
Download page Viewing Results for CWMS Alternatives.
Viewing Results for CWMS Alternatives
HEC-HMS may be used for hydrologic simulation within the Corps Water Management System (CWMS). The CWMS includes tools for developing meteorologic scenarios based on weather forecasts. The CWMS also includes other simulation models for reservoir operations, river hydraulics, and economic impact. Forecast alternatives created in HEC-HMS can be used in CWMS. An overarching CWMS alternative includes a meteorologic scenario with a HEC-HMS forecast alternative plus other simulation model alternatives. The CWMS alternative can be computed and results viewed through its own program interface. Information from the CWMS alternative is retained within the HEC-HMS forecast alternative, allowing for computing it and viewing results at a later time.
To begin viewing results, go to the "Results" tab of the Watershed Explorer and click on the desired CWMS forecast alternative icon. The CWMS forecast alternative includes the alternative label. The alternative label is typically four characters, for example, N0A0. The original HEC-HMS forecast alternative will be labeled as Default once it has been used in CWMS. If necessary, click on the "Forecast Alternatives" folder to expand it and view the alternative in the project. The CMWS forecast alternative icon will be disabled if any data used in the alternative has changed and results need to be recomputed. If any result is open at the time data changes, the affected results will be automatically updated.
Individual Elements
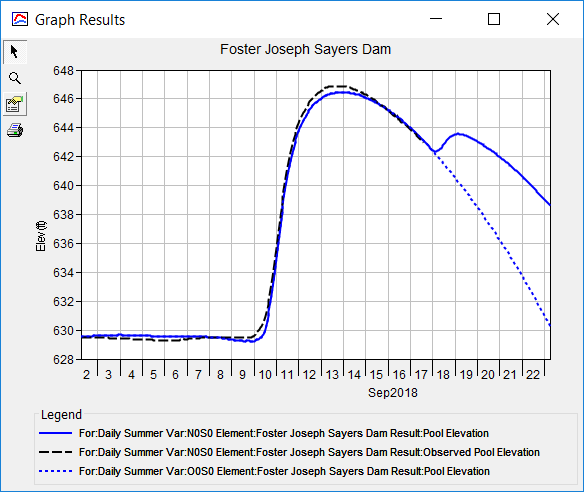
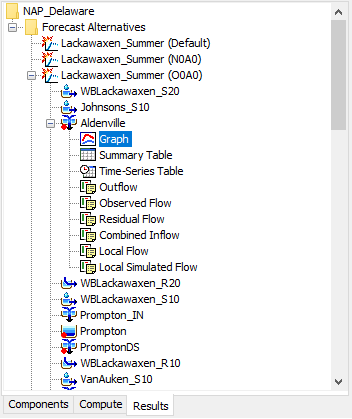
Each element in the basin model used in the CWMS forecast alternative is shown in the Watershed Explorer under the CWMS forecast alternative node. These elements are listed in hydrologic order. The results for each element are accessed by clicking on its node. The first item listed for each element is the graph; click on the "Graph" node to view the result, as shown in Figure 1. It is exactly the same graph that can be viewed for the default forecast alternative. The information included in the graph varies by element type but always includes outflow. Optional items such as observed flow, computed stage, and observed stage are also included. Similarly, the summary table and time-series table can also be accessed by clicking on the "Summary Table" or "Time-Series Table" node, respectively.
Element Time-Series Preview Graph
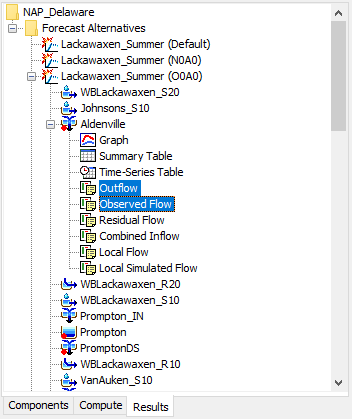
All of the time-series data computed by an individual element are available for viewing. The time-series data are listed under each element node in the Watershed Explorer. The first node under each element is the graph, followed by the summary table and time-series table. The remaining nodes for each element represent the different time-series data. Click on a time-series node to preview the data in the Component Editor. You may select multiple time-series data by holding the shift or control key while using the mouse to click on additional nodes, as shown in Figure 2. The selected time-series may come from different elements in the same CWMS forecast alternative, or the same element in two different CWMS alternatives, or the same element in the default alternative and one or more CWMS alternatives. Results can also be combined from simulation runs, optimization trials, depth-area analyses, and forecast alternatives. The selected time-series data will automatically be partitioned into groups by data type.
Time-Series Tables and Graphs
Preview graphs of selected time-series data can be opened as graphs or time-series tables within the Desktop area. Begin by selecting the time-series you wish to include in the graph or table. Once you have selected the desired time-series, you can press the graph or time-series table buttons on the toolbar. The chosen time-series will be graphed or tabulated. An example is shown in Figure 3 where results from a forecast alternative with future precipitation (solid blue line) and a forecast alternative with no future precipitation (dashed blue line) are compared against observed data (black line) at a reservoir for the same time period.