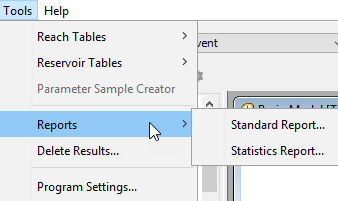
Standard Report
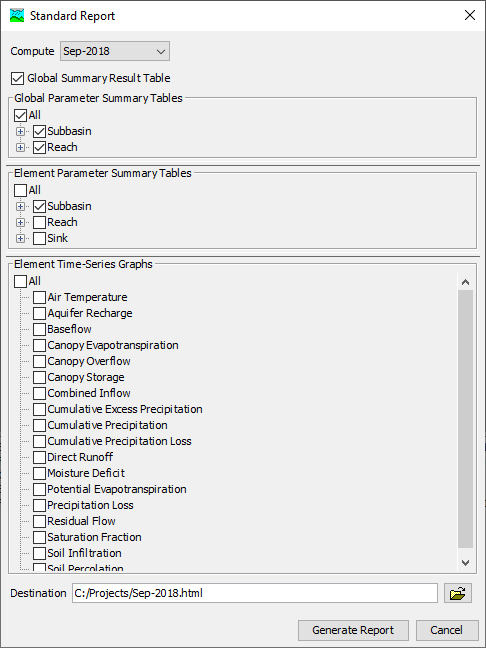
The Standard Report option creates an HTML report with options to include global parameter summary tables, a global results summary table, element parameter summary tables and result graphs for each basin element. Content can be customized using check box selections in the user interface. The report is written in HTML format and can be rendered in a browser.
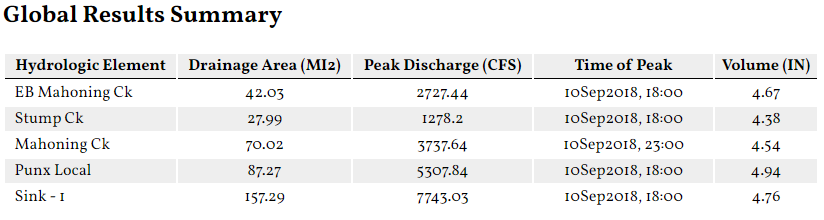
The global summary results table shows summary results for each element. The image below shows an example global summary results table.
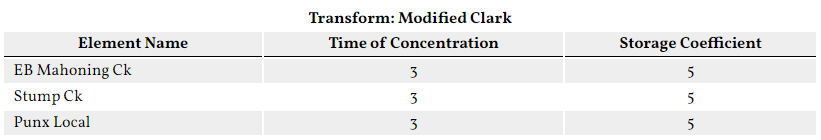
Global parameter summary tables show, for a given method, parameterization for each element. The image below shows the global parameter summary table for mod Clark transform:
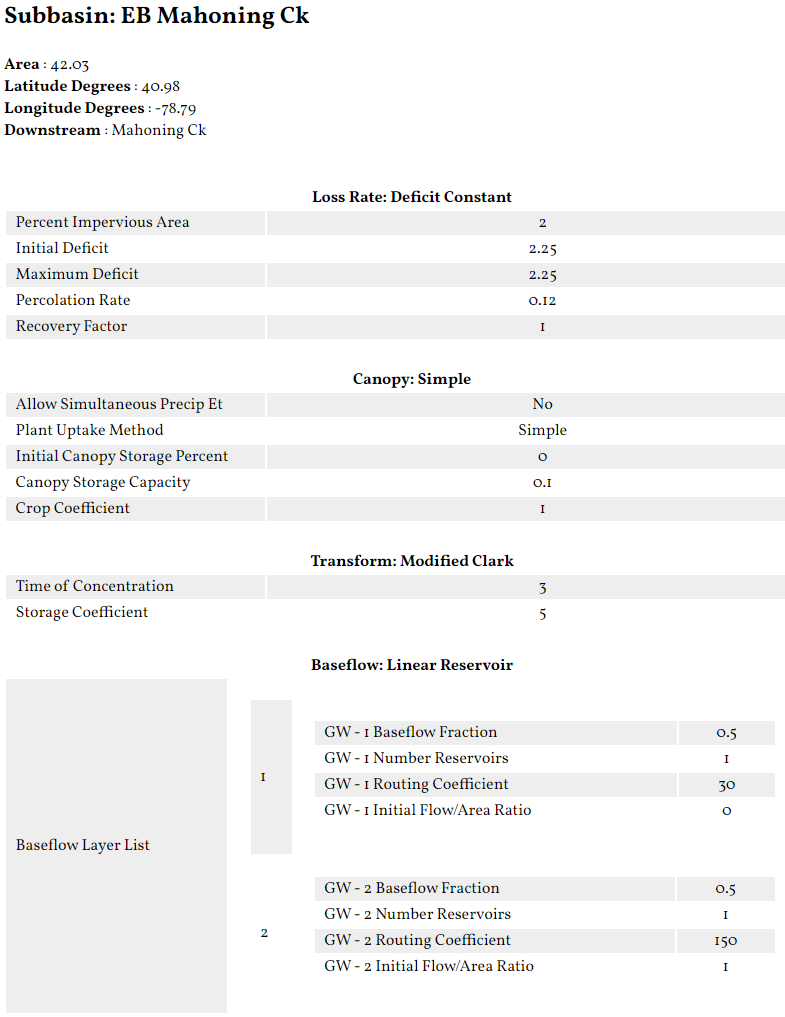
Element parameter summary tables show, for a given element, all parameterizations. The image below shows an example element parameter summary table.
Element summary results are shown by default:
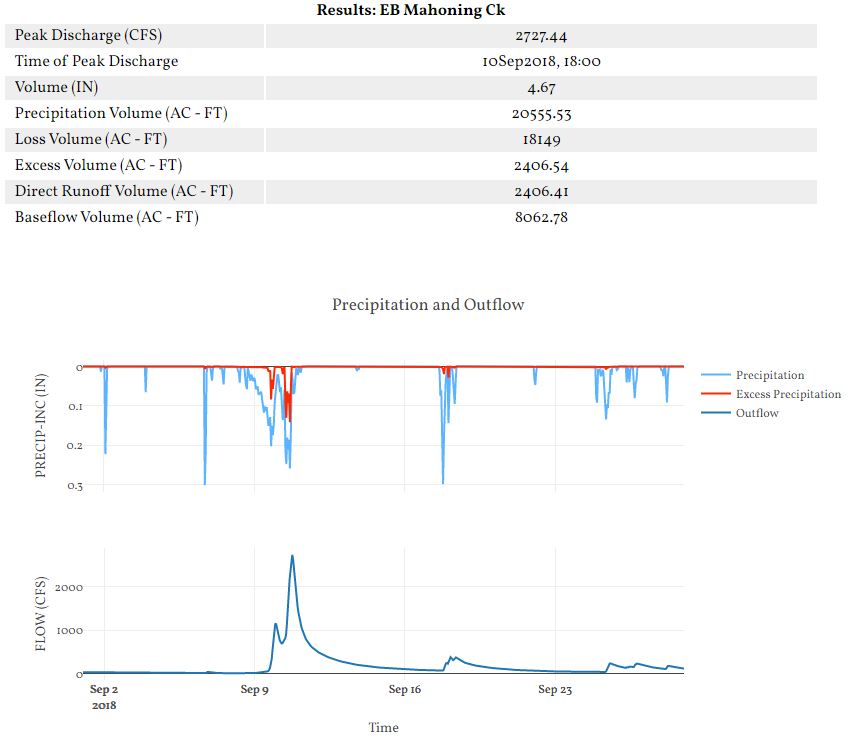
Additional time-series graphs can be added to the report by selecting variables in the Element Time-Series Graphs section of the Standard Report dialog.
Statistics Report
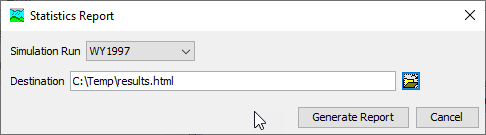
The Statistics Report option creates an HTML report with summary statistics for all observed flow locations in a simulation. Summary statistics included in the report are: Coefficient of Determination (R2), Nash Sutcliffe Efficiency (NSE), Root Mean Squared Error Ratio (RSR), and Percent Bias (PBIAS). The following figure show the Statistics Report editor. A simulation run must be selected, all locations with observed flow will be included in the report. An output html file must be defined to store the summary results.
The following figure shows a statistics report for a large basin model that included a number of elements with observed flow.
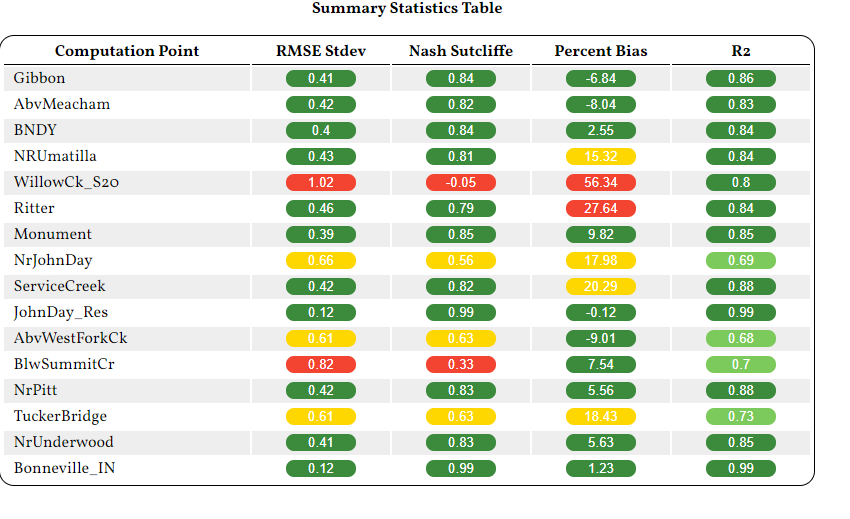
The default color codes for each statistic are presented below:
Color Code | R2 | NSE | RSR | PBIAS |
Dark Green | 0.65<R2≤1.00 | 0.65<𝑁𝑆𝐸≤1.00 | 0.00<𝑅𝑆𝑅≤0.60 | 𝑃𝐵𝐼𝐴𝑆< ±15 |
Light Green | 0.55<𝑅2≤0.65 | 0.55<𝑁𝑆𝐸≤0.65 | 0.60<𝑅𝑆𝑅≤0.70 | ±15≤𝑃𝐵𝐼𝐴𝑆<±20 |
Orange | 0.40<𝑅2≤0.55 | 0.40<𝑁𝑆𝐸≤0.55 | 0.70<𝑅𝑆𝑅≤0.80 | ±20≤𝑃𝐵𝐼𝐴𝑆<±30 |
Red | 𝑅2≤0.40 | 𝑁𝑆𝐸≤0.40 | 𝑅𝑆𝑅>0.80 | 𝑃𝐵𝐼𝐴𝑆≥±30 |