Download PDF
Download page v.4.6.0 Release Notes.
v.4.6.0 Release Notes
Beta release:
Final release:
New Features
ASCII precipitation-frequency grid
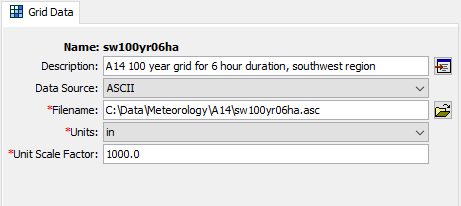
A new precipitation-frequency parameter grid type was added to support the new precipitation-frequency grid option in the hypothetical storm. The program's grid management framework was generalized to support alternative file formats to the traditional HEC-DSS format. The initial implementation allows for an ASCII formatted, precipitation-frequency grid, which is the format distributed in NOAA Atlas 14. The grid Component Editor allows the user to select data units and a multiplication factor that represents the multiplication factor that is applied to persisted data. For example, precipitation-frequency data is commonly distributed in terms of 1/1,000 (NOAA Atlas 14) inches or 1/100,000 inches (NOAA Atlas 2). It is anticipated that the revised grid management framework will be used to accommodate other raster formats, such as GeoTIFF, in the future.
The ASCII precipitation-frequency grid was funded through an agreement with the Flood Control District of Maricopa County, Arizona. The initial code implementation was done by Thomas Brauer with testing by Gregory Karlovits and Thomas Brauer.
For more information see Grid Data.
NOAA Atlas 14 precipitation-frequency grid referenced in the Grid Data component editor:
Precipitation-frequency grid option in hypothetical storm
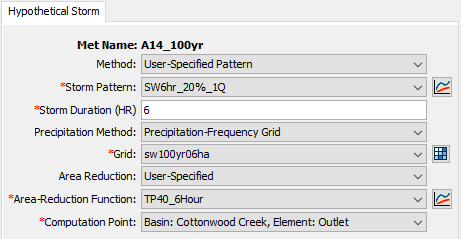
In addition to specifying a single point depth value to be reduced to a watershed average, the hypothetical storm now allows specification of precipitation-frequency parameter grid. When the precipitation-frequency grid option is used within the Hypothetical Storm precipitation method, the program will extract the average value from the precipitation-frequency grid (using a zonal statistics computation). This area-average point precipitation depth will be reduced using the selected area reduction method, along with the drainage area above the computation point (the storm area is assumed to equal the drainage area). The option to use a precipitation-frequency grid will only work with basin models that have GIS elements for the subbasin elements.
The precipitation-frequency grid option in the hypothetical storm was funded through an agreement with the Flood Control District of Maricopa County, Arizona. The initial code implementation was done by Thomas Brauer and Gregory Karlovits.
For more information see Precipitation.
Precipitation-frequency grid option in the Hypothetical Storm editor panel:
Depth-area analysis with precipitation-frequency grid hypothetical storm
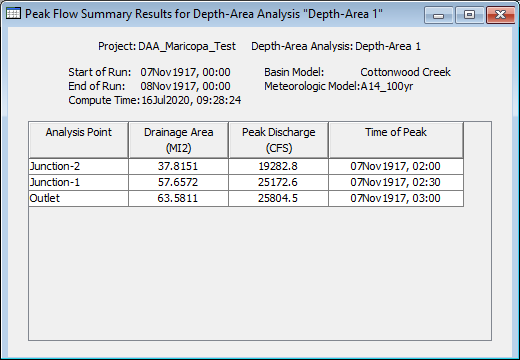
The Hypothetical Storm meteorologic model can now be used in conjunction with the Depth-Area Analysis simulation type so that several analysis points can be specified. When a precipitation-frequency grid is used within the Hypothetical Storm, the Depth-Area Analysis will automatically compute 1) the corresponding area-average point precipitation-frequency value for the drainage area above the analysis point using the precipitation-frequency grid, and 2) the area reduction factor associated with the analysis point by computing the drainage area above the point, and setting it equal to the storm area for the area reduction factor lookup.
The depth-area analysis with precipitation-frequency grid in the hypothetical storm was funded through an agreement with the Flood Control District of Maricopa County, Arizona. The initial code implementation was done by Gregory Karlovits.
For more information see Applying Depth-Area Analysis to Precipitation-Frequency Grids.
Depth-area-analysis results from precipitation-frequency grid hypothetical storm:
Gumbel Distribution in Uncertainty Analysis
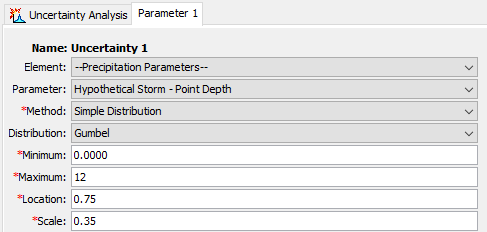
The Gumbel distribution was added to the list of probability distributions that are available for random sampling in the Uncertainty Analysis.
The initial code implementation was done by Gregory Karlovits.
Example of the Gumbel distribution sampling point precipitation depth for the Hypothetical Storm:
Standard Reports
An HTML report generator has been added to the HEC-HMS Tools | Reports menu. The Standard Report option allows the user to create an HTML report with global parameter summary tables, a global results summary table, element parameter summary tables and result graphs for each basin element. Users are able to customize the report using check box selections in the user interface.
The standard reports feature was funded through an agreement with the Flood Control District of Maricopa County, Arizona. The initial code implementation was done by Nick Van and Thomas Brauer.
For more information see Reports.
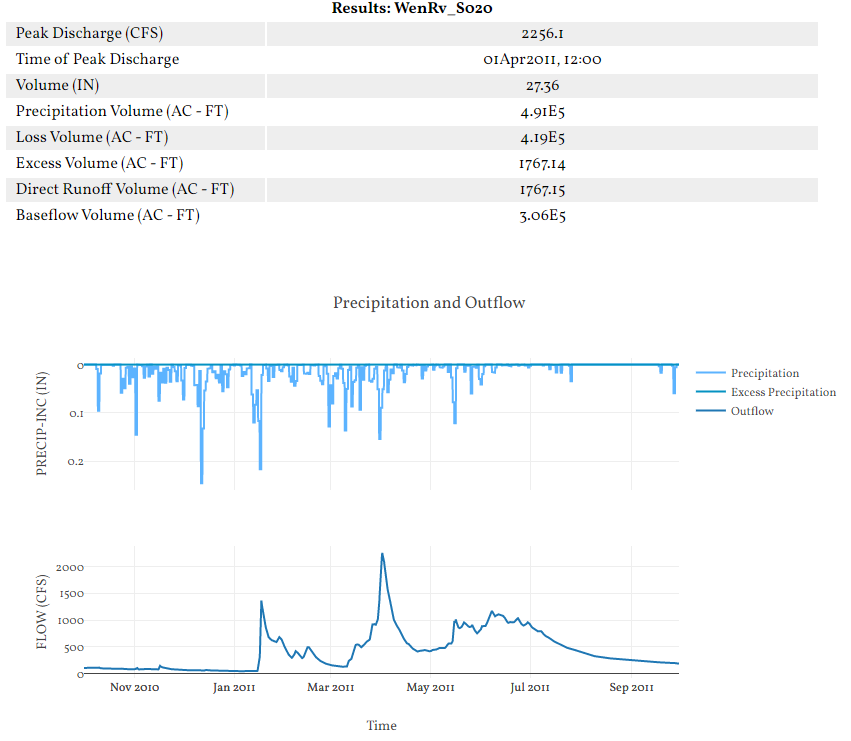
Subbasin results content in the standard HTML report:
Global Monthly Average Evapotranspiration Editor
A global editor was added for the monthly-average evapotranspiration method. Previously, 12 monthly-average evaporation rates and 12 pan coefficients had to be entered for each subbasin. With the global editor, users can now enter the values once for all subbasins using tabular-fill options to assist in the process.
This feature was funded through the USACE technical engineering support account and through the CWMS National Implementation Program. The initial code implementation was done by Thomas Brauer.
For more information see Program Screen.
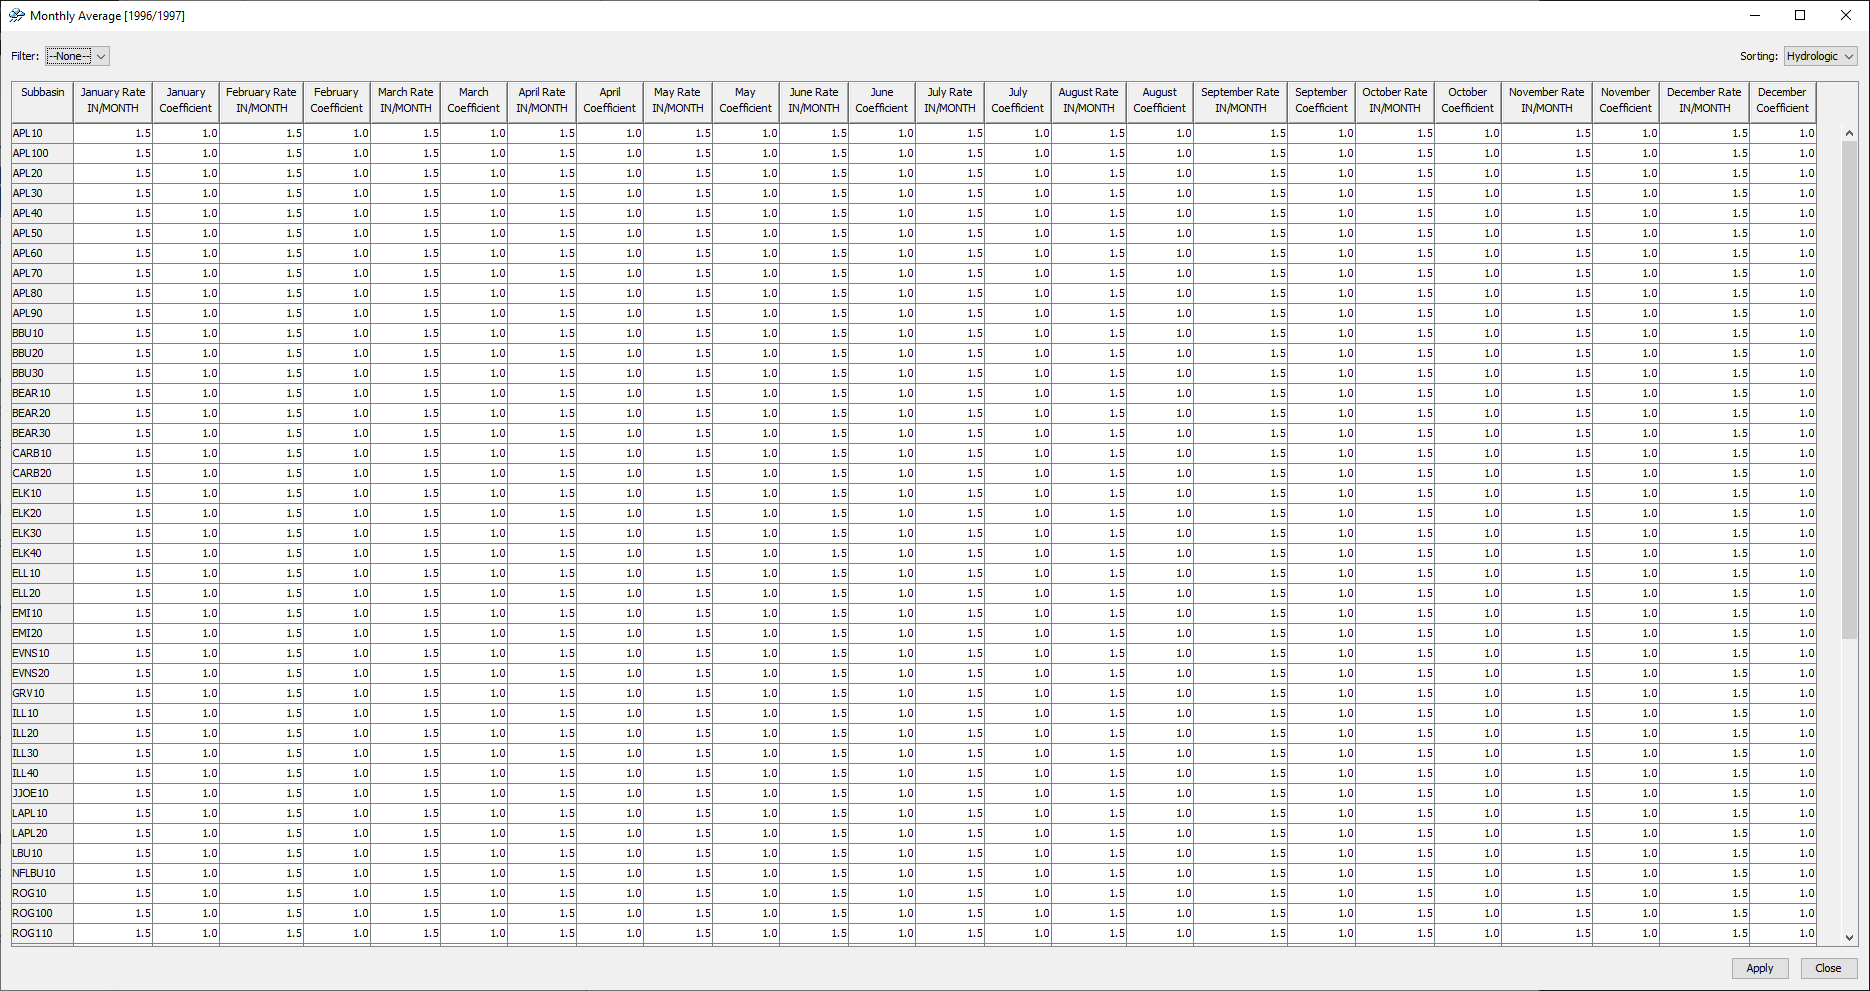
Monthly-average evapotranspiration global editor:
macOS Portable Distribution
A macOS portable distribution was added, in addition to our Windows and Linux distributions. See the Installation section of the User's Manual for instructions on installing and running on macOS.
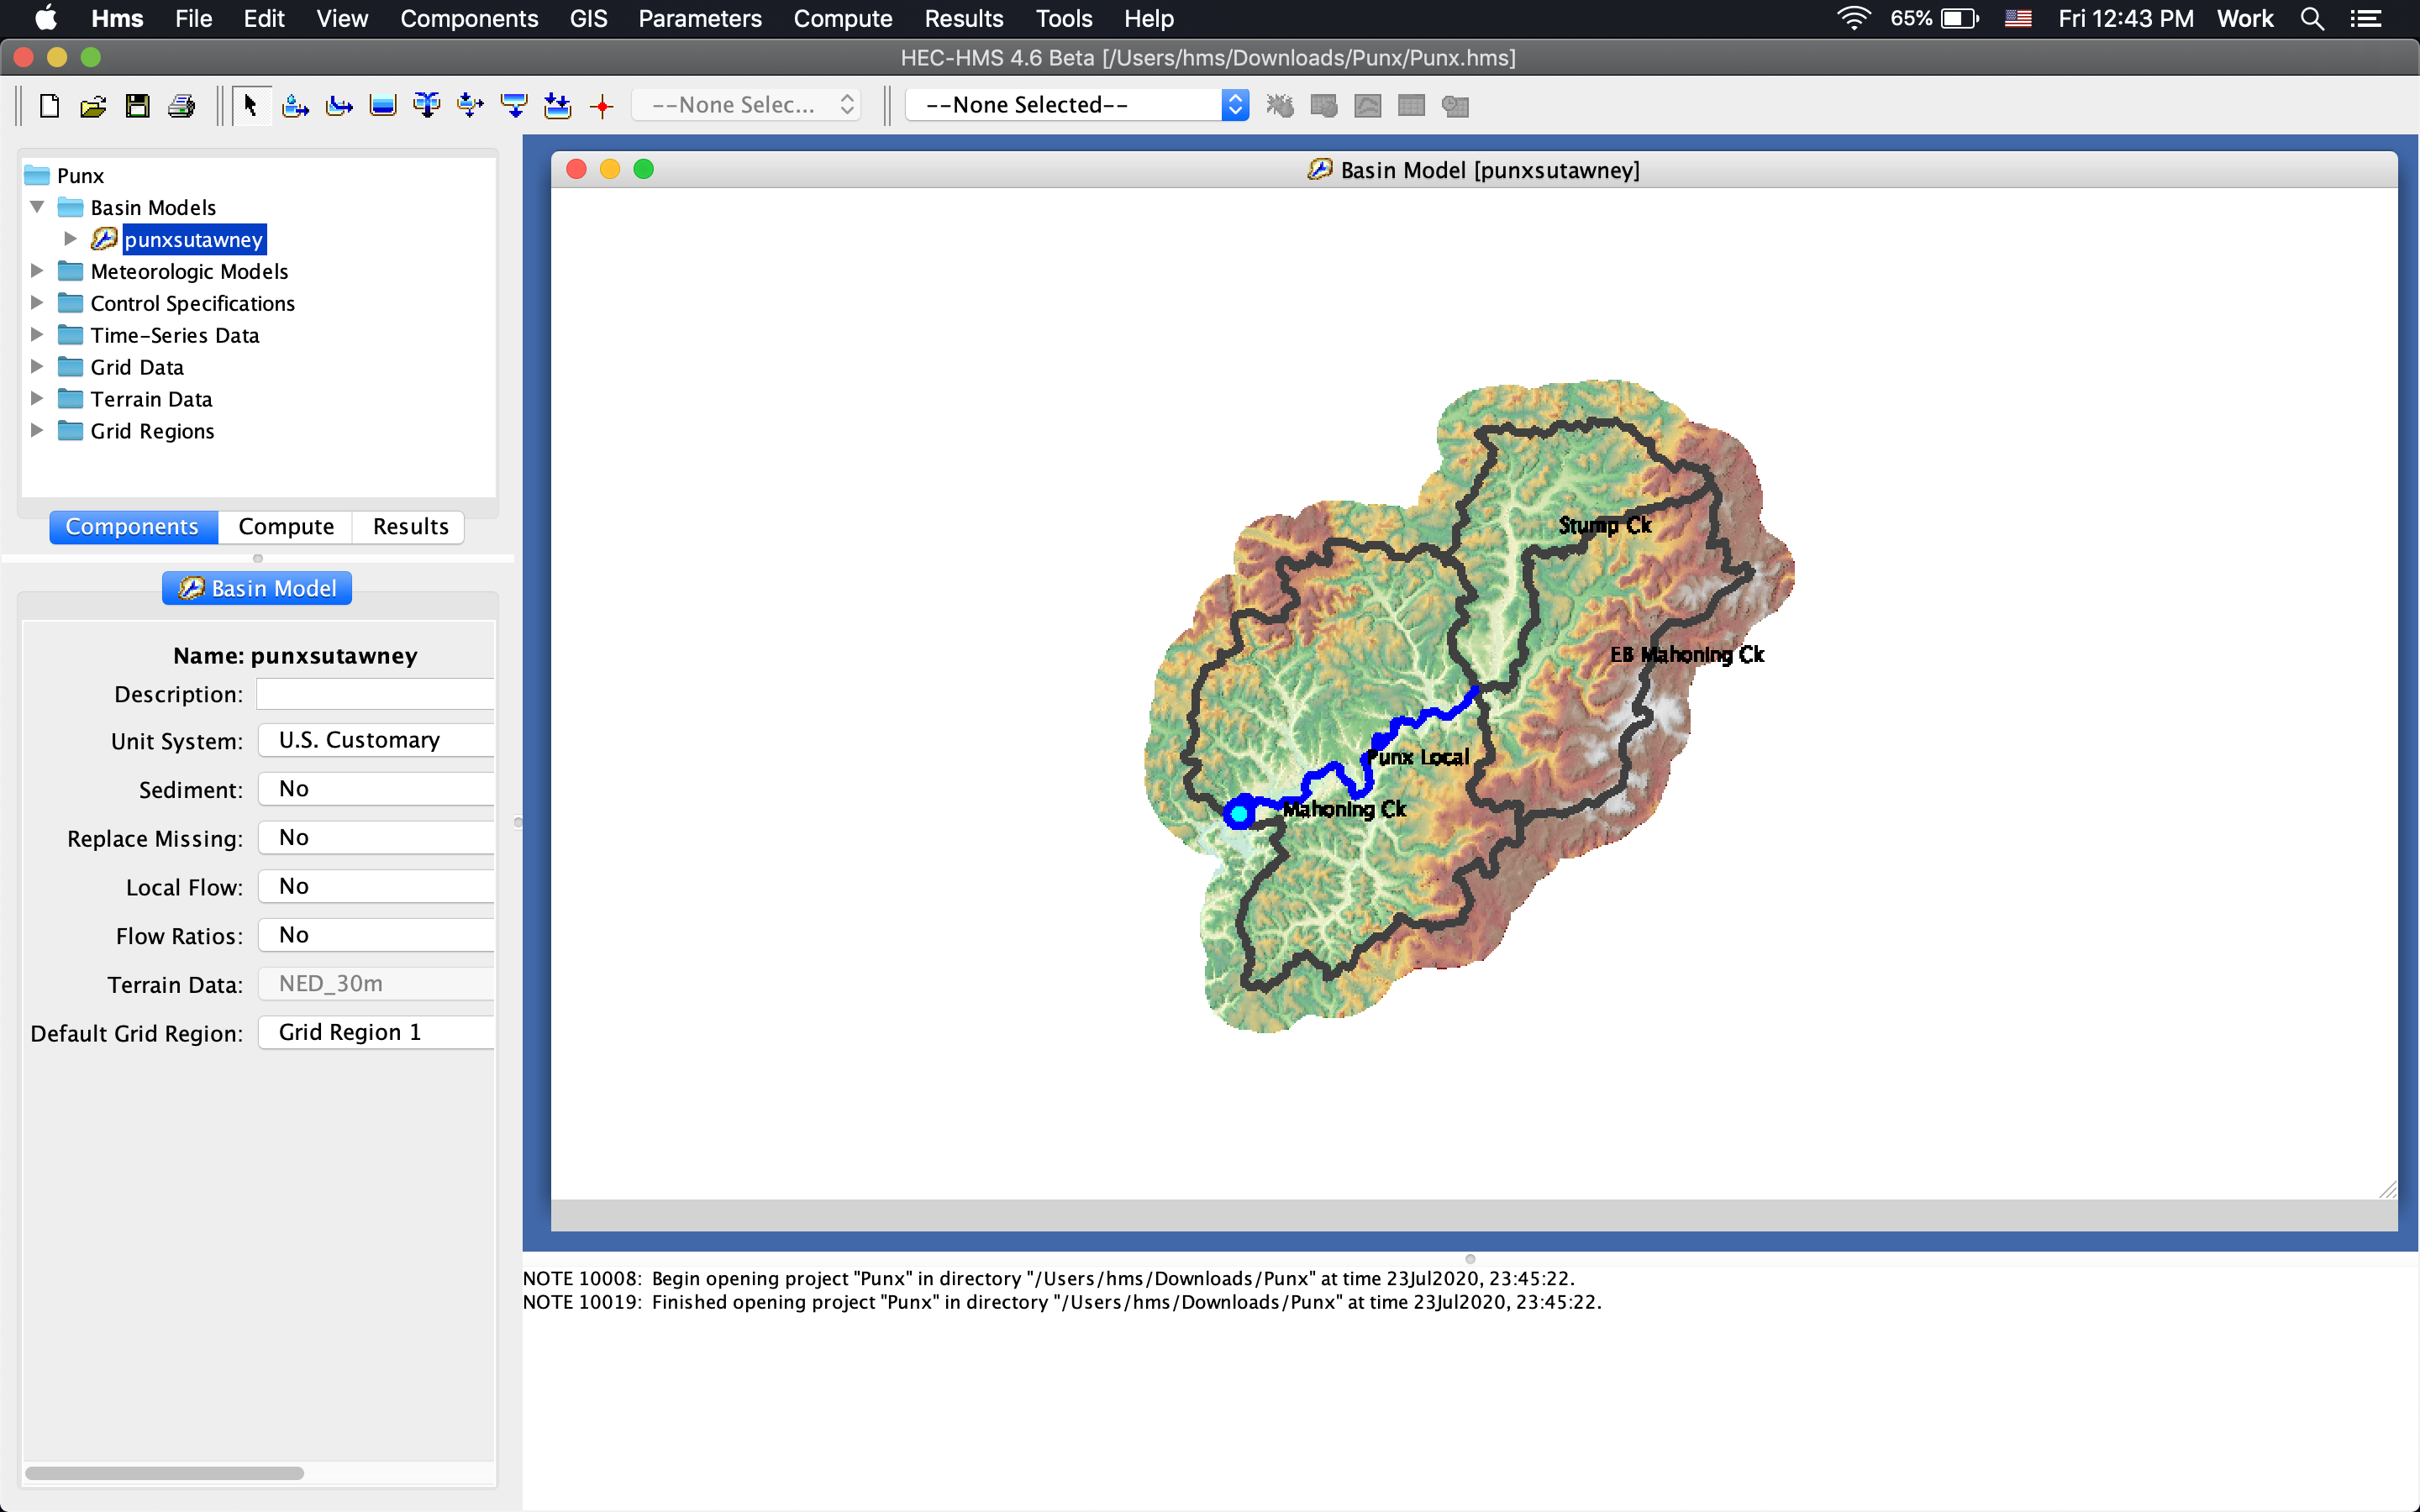
macOS user interface:
Beta Releases
- Initial beta release.
- Fixed an issue where log messages were not being flushed to the project log file. Previously, the project log file was often empty because log messages were not being flushed. Now the project log file should have content similar to the message log in the user interface.
- Updated GDAL library version to 2.4. It is anticipated this this will help with GDAL library load issues.
- Fixed an issue where where only the lower half of icon-style reaches were being displayed. This issue was related to library updates and refactoring done in the previous beta release.
- Updated standard reports logic to accommodate all simulation types. Fixed bug where some debris-yield results were being written as NaN rather than 0.
- Updated standard report format.
- Fixed an issue where TauDEM binaries were compiled as "Debug" and failed at runtime if Visual C++ debug dependencies were not found. The TauDEM binaries distributed with HEC-HMS were updated to "Release." Updated GDAL binaries to a newer release of v.2.4.4. Fixed an issue in the previous beta release that prevented the statistics report from generating. Generalized some parts of the code in preparation for a macOS X release.
- Added global monthly-average evapotranspiration editor.
- Updated standard report format.
- Added protections for raster file types without coordinate reference system. Removed zoom limit when zooming in with mouse wheel.
- Fixed issue in case of subbasin computation point in precip-frequency grid hypothetical storm. Previously the subbasin was not being included in upstream elements.
- Fixed issue of null projection in gridded precipitation frequency storm computer.
- Fixed minor error checking and UI interaction issues with precip-frequency grid hypothetical storm. Added DSS precipitation-frequency grid support. Added Gumbel distribution to uncertainty analysis.
General Acknowledgments
Many engineers, computer specialists, and student interns have contributed to the success of this project. Each one has made valuable contributions that enhance the overall success of the program. Nevertheless, the completion of this version of the program was overseen by Matthew Fleming while Christopher N. Dunn was Director of the Hydrologic Engineering Center. Thomas Brauer led the HEC-HMS team during the Version 4.6 release cycle. HEC-HMS team members include Thomas Brauer, Michael Bartles, David Ho, Gregory Karlovits, Jang (Jay) Pak, Alejandro Sanchez, and Nick Van.