The Map Layers tab gives access to which map layers are drawn and in which order it occurs. These properties are inherited as a block. Once a property is changed in the map or session, it maintains its own copy of all these properties from that point forward.
The following table provides definitions for the features available in the Map Layers tab.
Map Layer Settings Options
Definition
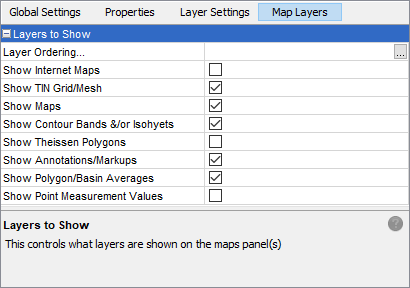
Layer Ordering…
Displays the editor shown in the figure below to set the order that the map layers are rendered in. The layers can also be enabled or disabled from this dialog. The remaining settings in this tab group reflect the ordering set in by this editor.
Show Internet Maps
If selected this will show maps retrieved from a map server such as Google Maps. Currently internet maps are displayed only when the Map Window projection is set to 'Trivial'
Show Maps
If selected, the active maps are drawn. The position within the property sheet indicates the drawing order. In this example, the maps layer will be drawn first.
Show Contour Bands &/or Isohyets
If selected, renders the contour layer.
Show Polygon/Basin Averages
If selected, renders the basin average layer. Note that basin averages are computed for a Map Window when it is drawn regardless of whether they are displayed on the Map Window. They will be tabulated in the message area on the basin averages tab.
Show Point Measurement Values
If selected, displays the point measurement values at the triangle vertex points of the TIN. It is linked to the contour palette and scale choices for color choices.
Show Tin Grid/Mesh
If selected shows a wire frame of the TIN
Show Thiessen Polygons
Shows the polygons computed by creating a perpendicular bisector of all the TIN triangle sides and connecting them to the bisectors of the adjacent triangles.
Show Annotations/Markups
If selected, renders the annotations from the currently selected annotation layer files.