The Map Layers tab gives access to which map layers to display and in which order. These properties are inherited from the Project to the Session and Map Window. Once a property is changed in a Session or Map Window, the Session or Map Window maintains its own copy of all these properties from that point forward. 

The following table provides definitions for the features available in the Map Layers tab.

Map Layer Settings Options

Definition

Layer Ordering…

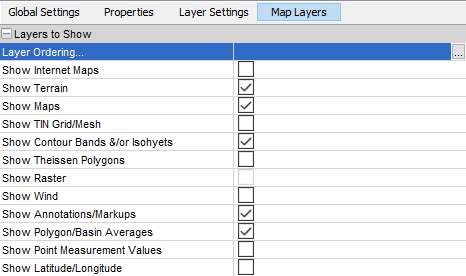
Brings up the dialog shown in the figure below to set the order that the map layers are rendered in, where the display of layers ordered later would overlay the display of layers that are ordered earlier.

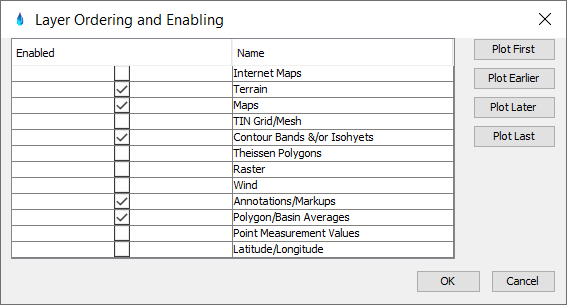
The display of layers can also be enabled or disabled from this dialog. The remaining settings in this tab group reflect the layer display ordering set by this dialog.

Show Internet Maps

If enabled this will show maps retrieved from a map server such as Google Maps.

Show Terrain

If enabled, this will show the terrain layer for a given .tif file specified under the terrain file node for the Map Window. 

Show Maps

If enabled, the active (basin average and/or background) maps are drawn in the Map Window.

Show Tin Grid/Mesh

If enabled, the wire frame of the TIN is shown in the Map Window.

Show Contour Bands &/or Isohyets

If enabled, the contour layer is rendered in the Map Window.

Show Thiessen Polygons

If enabled, the Thiessen polygons (computed by creating a perpendicular bisector of all the TIN triangle sides and connecting them to the bisectors of the adjacent triangles) are shown in the Map Window.

Show Raster

If enabled, the raster layer is rendered in the Map Window. 

Show Wind

If enabled, the wind vectors (using pairs of the wind speed and direction datasets loaded in the same Map Window) are displayed in the Map Window.  Essentially, whether loading wind speed and direction TINs for a single time interval or multiple time intervals, pairs of wind speed and direction

Note: TINs with matching times must be loaded into the same Map Window in order for the wind vector layer to be computed and displayed. 

Show Annotations/Markups

If enabled, the annotations from the currently selected annotation layer files are shown in the Map Window.

Show Polygon/Basin Averages

If enabled, the basin average layer is rendered in the Map Window. Note that basin averages are computed for a Map Window regardless of whether or not the basin averages layer is enabled to be displayed in the Map Window. Also, basin averages will always be tabulated in the messages area of the basin averages tab.

Show Point Measurement Values

If enabled, the point measurement values at the triangle vertex points of the TIN will be rendered in the Map Window. The Point Measurements Values layer is linked to the selected Color Scale for the Map Window.

Show Latitude/Longitude

If enabled, the latitude and longitude lines are displayed in the Map Window.