Triangulated Irregular network (TIN)
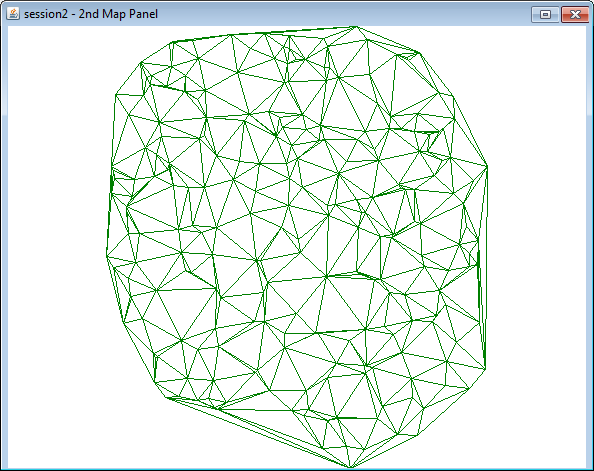
A triangulated Irregular network (TIN) is a dataset made up of interconnected points forming a series of triangles. The triangle vertices are the points with a known measurement value. The majority of the computations HEC-MetVue performs use this interconnected set of triangles as its basis for the [X, Y] components of the dataset. This triangulation is referred to as a Delaunay Triangulation. The mathematics for generating this triangulation are beyond the scope of this manual, however, a Delaunay Triangulation states that given any three points that make up the vertex of a triangle within the dataset, a circle that contains these points on the circumference of a circle will contain no other points within the circle. The inverse of a TIN, created from bisecting each line in a TIN with a perpendicular line and then interconnecting those intersecting lines forms a Voronoi Diagram, is also known as Thiessen polygons. An example TIN is shown below.
Gridded Datasets
Gridded datasets, as the name implies, are made up of a grid of data that is typically in rows and columns, at least in the map projection in which it is stored. Implied from this is the fact that the same gridded data, in some other map projection, will likely not be either equidistant or rectangular. In addition, in terms of geometric computations, gridded datasets are degenerate, meaning they can contain more than one solution to the same problem. Refer to the grid cell below.
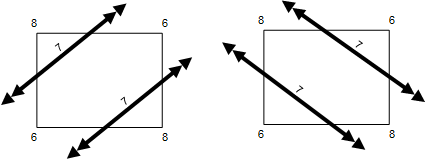
The numbers in the corner are the measurements at those locations. The thick double arrow lines represent the contours passing through the cell. Note that there are 2 solutions to the same problem and therefore the dataset is degenerate. There is not a right or wrong solution to this, only two equally valid solutions. As both solutions are equally valid, the program simply bisects each grid cell, turning each one into two triangles. TIN algorithms are then used in nearly all computations, except for some search algorithms (in particular for Depth-Area-Duration computations) that are optimized for gridded data sets. After gridded data is loaded, and triangulated, it is treated as Triangulated Regular Network (TRN).