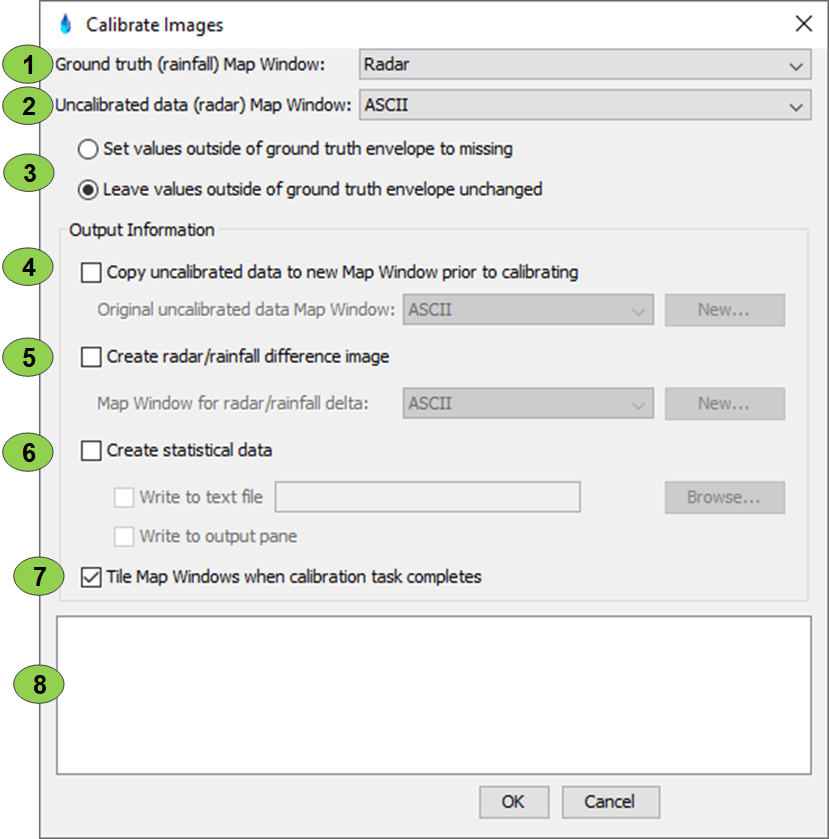
The calibration tool is available on the program toolbar by pressing the icon. The icon may be greyed out if no map window has been selected. Once pressed, a dialog is displayed. The table below provides a description for the features of the calibration tool.
Item
Description
1
This dropdown is used to set the map window that contains the control TIN to use in the calibration. It is usually a TIN type that is identified internally as a gaged precipitation type of image. Images that are of this type are in bold text in the dropdown to help in the selection; however, any valid map window may be selected for the control, even another radar image.
2
This dropdown is used to set the map window that contains the target TIN to use in the calibration. It is usually a TIN type that is identified internally as an uncalibrated radar image type. Images that are of this type are in bold text in the dropdown to help in the selection however any valid map window may be selected for the target.
3
This control defines whether the resultant TIN created should be trimmed outside the area defined by the control TIN. The algorithms which calibrate the image only do so within the perimeter of the control TIN.
4
Enable this option to copy the original uncalibrated TIN prior to calibration. This option makes it straightforward to compare the calibrated and uncalibrated TIN. The 'New…' button can be used to create a new map window in the session window. If a new map window is created, it copies the map window defined in 2 above to obtain its shapefiles and basin average files. If the map window already exists it uses the current settings without copying them.
5
Enable this option to create a radar/rainfall difference TIN and place it in the specified map window. The 'New…' button can be used to create a new map window in the session window. If a new map window is created, it copies the map window defined in 1 above to obtain its shapefile and basin average files. If the map window already exists, it uses the current settings without copying them. Because the scale used to display differences may be different than the normal scaling it may be better at times to specify an existing map window with a specialized scale just for displaying differences. This map can be invaluable in visually spotting errant control gages.
6
These controls are used to create the statistical data. The statistical data is a listing of the control gages ranked by the fit with the radar TIN. This file can be invaluable in locating errant control gages. Although HEC-MetVue cannot determine which gages are in error versus those that simply have a poorer fit, the gages that are errant tend to have a higher ranking.
7
This is used to tile the map windows after the calibration computations have completed.
8
This is the location where any errors or warnings are shown which will result in the calibration failing. If there are any errors, pressing the 'OK' button will not dismiss the dialog.