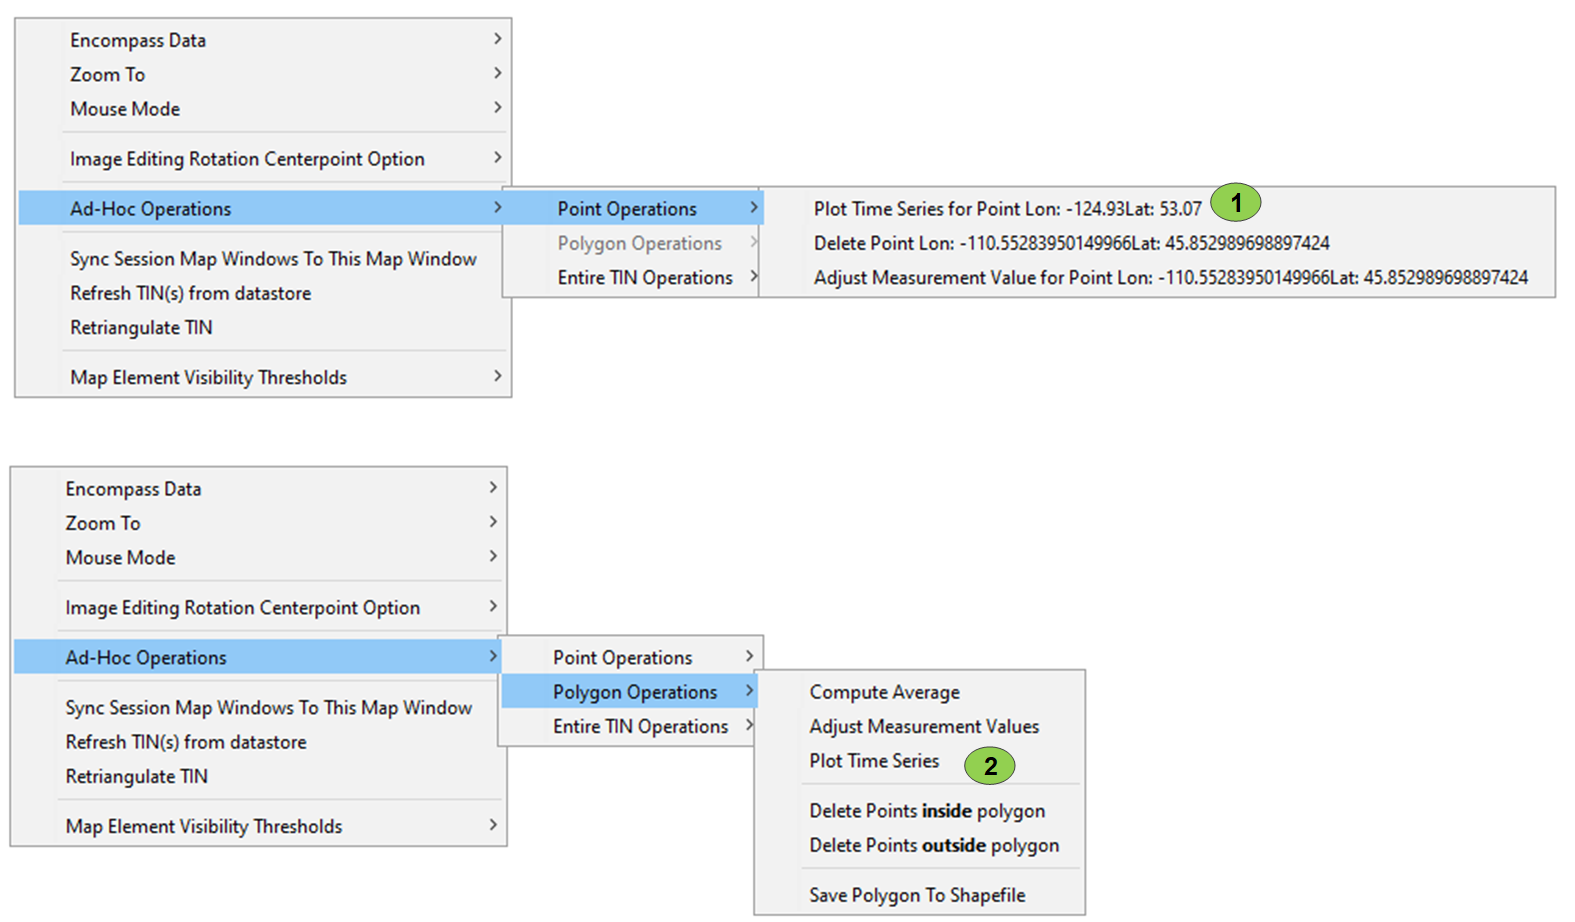
HEC-MetVue allows for plotting time series for both points and polygons selected in a Map Window. This allows for comparing the temporal distribution of meteorological data between different geographic locations and/or areas. When there is data loaded into the Map Window, these plots can be accessed through the right-click context menu as shown below:
Time Series From Points
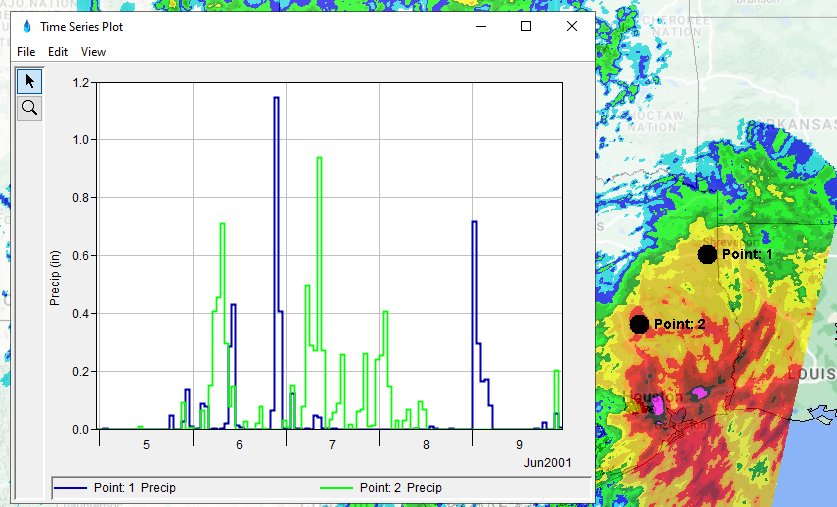
When the "Plot Time Series For Point" option is clicked, HEC-MetVue samples the value for that location in each TIN/Grid loaded into the Map Window. After gathering these values, the time series is plotted in a new dialog, and an accompanying point is displayed on the Map Window, identifying the location from which the time series was sampled. This is shown in the image below, where time series from two points were computed. Labeling on the map is consistent with labeling in the plot, allowing for identification of the point from which each time series was sampled.
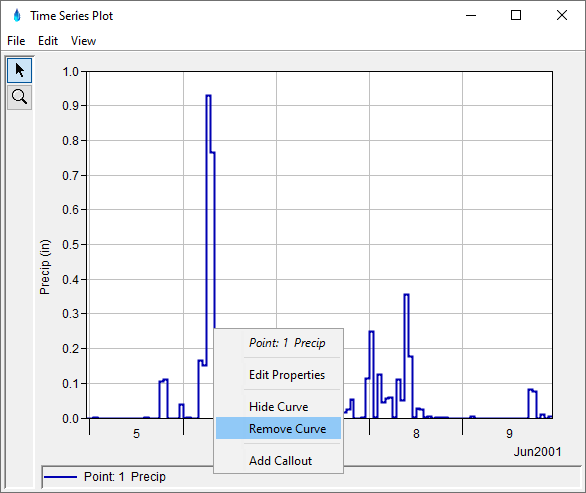
Additionally, time series, and their associated points in the Map Window, can be removed by removing them from the plots by right-clicking on the curve (see below). If the plot is closed, all time series in the plot will be removed.
Time Series From Polygons
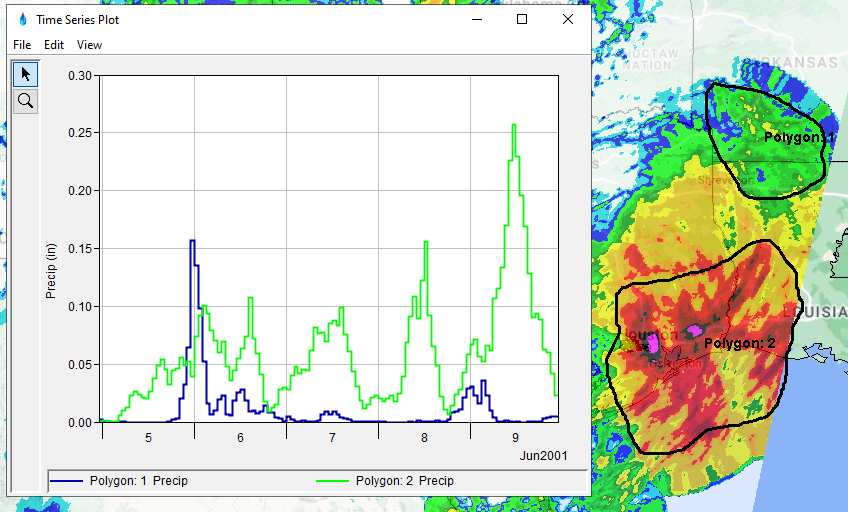
After creating a polygon in the Map Window, and subsequently selecting the "Plot Time Series" option in the "Ad-Hoc Polygon Operations" menu, the average value within that polygon will be computed for each TIN/Grid loaded into the Map Window. This creates a time series that will be plotted in a separate window, and the polygon will become persistent on the map. This functions similar to time series from points, and can be used in conjunction with time series from points. Below is an image showing the result of plotting two polygon average time series.