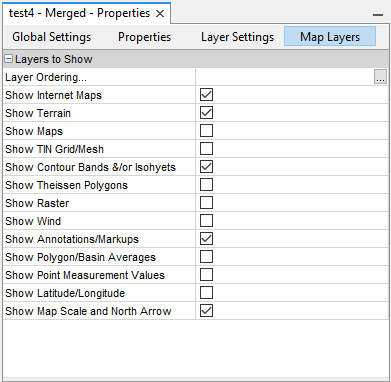
Map Layer Settings Options | Definition |
Layer Ordering… | Displays the editor shown in the figure below to set the order that the map layers are rendered in. The layers can also be enabled or disabled from this dialog. The remaining settings in this tab group reflect the ordering set in by this editor. |
Show Internet Maps | If selected this will show maps retrieved from a map server such as Google Maps. Currently internet maps are displayed only when the Map Window projection is set to 'Trivial' |
Show Terrain | If selected, this will show the terrain layer for a given .tif file specified under the terrain file node for the map panel. |
Show Maps | If selected, the active maps are drawn. The position within the property sheet indicates the drawing order. In this example, the maps layer will be drawn first. |
Show Tin Grid/Mesh | If selected shows a wire frame of the TIN |
Show Contour Bands &/or Isohyets | If selected, renders the contour layer. |
Show Thiessen Polygons | Shows the polygons computed by creating a perpendicular bisector of all the TIN triangle sides and connecting them to the bisectors of the adjacent triangles. |
Show Raster | If selected, renders the raster layer. |
Show Wind | If selected, renders wind vectors using pairs of the wind speed and direction datasets loaded in the same Map Window. Essentially, whether loading wind speed and direction TINs for a single time interval or multiple time intervals, pairs of wind speed and direction TINs with matching times need to be loaded into the same Map Window in order for the wind vector layer to be computed and displayed. |
Show Annotations/Markups | If selected, renders the annotations from the currently selected annotation layer files. |
Show Polygon/Basin Averages | If selected, renders the basin average layer. Note that basin averages are computed for a Map Window when it is drawn regardless of whether they are displayed on the Map Window. They will be tabulated in the message area on the basin averages tab. |
Show Point Measurement Values | If selected, displays the point measurement values at the triangle vertex points of the TIN. It is linked to the contour palette and scale choices for color choices. |
Show Latitude/Longitude | If selected, displays latitude and longitude lines. |
Show Map Scale And North Arrow | If selected, the Map Scale and North Arrow layer will become visible. Note that the Map Scale and/or North Arrow need to be enabled in the Layer Settings to display this layer. |