Download PDF
Download page Projecting Spatial Data.
Projecting Spatial Data
When an aggregate TIN has been translated/rotated/scaled, it may be necessary to save the result using a projection instead of saving the native TIN. This is particularly true when working with gridded datasets due to the fact that a gridded dataset that is moved to a new position is no longer considered to be a rectangular grid by the program. This is due to the fact that the coordinate system in which the grid is defined may be different than the coordinate system in which the translation or rotation occurred. Use the 'File->Save Projection…
' selection on the main menu or the save projection icon on the toolbar to save a TIN projection.
When saving a projection, the program uses the same steps as discussed above for saving TIN datasets and then adds an additional step of projecting the TIN to the new grid selected for output. Currently, all projected results are obtained by sampling the measurement values of the modified aggregate and discrete TINs at the center points of the grid cells of the target projection grid. If the grid cell size of the target grid is the same size or smaller than the source grid, then the sampling method gives a good approximation of the original TIN. However, if this procedure is repeated by continually re-projecting a TIN that is itself a projection, the result will be a dataset with precision loss. This is analogous to using a camera to take a picture of a picture of a picture. Eventually the picture will become blurry.
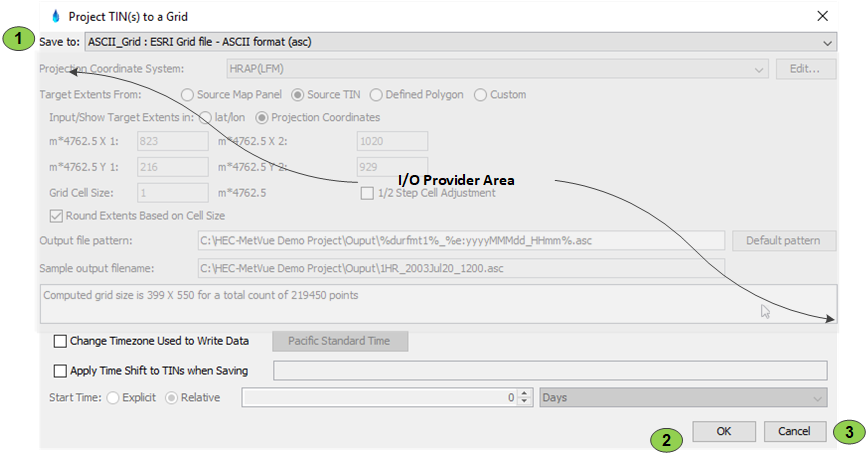
If a target grid is defined with grid cells that represent a significantly larger area than the source data, then the sampling method may not be appropriate. A better alternative may be to use a sampling technique that considers each grid cell to be a 'subarea' and compute an average value for each grid cell in the target grid. Another valid method may be to find the nearest defined measurement on the source grid and use this value for the target grid cell. This method is commonly called 'nearest neighbor' and there are variations on it which may find a nearest neighbor within a specified distance or fall back to TIN sampling. Also, the type of data must be considered. Precipitation data may be better projected using an average over area whereas elevation data may be better sampled using nearest neighbor. Currently, HEC-MetVue only provides support for nearest neighbor sampling within the command line utilities. See ProjectTinToGrid.
Similar to writing TINs, HEC-MetVue relies on I/O providers to project TINs. Not all I/O providers have projection capabilities. When the project tool is used, HEC-MetVue displays an editor similar to the one shown below. HEC-MetVue supplies a 'Save Projection' dialog that the various I/O providers can use, or the providers supply their own projection capability. The dropdown at the top of the dialog along with the 'OK' and 'Cancel' buttons is always controlled by HEC-MetVue. Depending on which I/O provider is selected the contents of 'I/O Provider Area' will change to support whatever information is required by that I/O provider to project the TINs. HEC-MetVue gives I/O providers access to its File and DSS Save Projection controls so that other providers that are saving to one of these types of storage medium do not have to create a custom control to do so. Other providers, such as a provider that stores results to an Oracle database or a remote web server, will likely have a completely different set of requirements for saving the edited data that cannot be satisfied by using one of the built in controls.
Item | Description |
1 | This dropdown gives a list to select the output target for the projected TINs. |
2 | Press this button to dismiss the dialog and save the projected TINs with the options given. |
3 | Cancel the operation. |