Frequently Asked Questions
Written August 2022
Overview
The 2022 version of the National Structure Inventory (NSI) uses a variety of data inputs in order to estimate structure locations, structure characteristics, and population at risk estimates. For an explanation of the NSI generation process, please refer to the official NSI documentation. This document attempts to showcase common limitations of the data. Users should evaluate the data's quality within their own study area and mitigate the issues as necessary.
Frequently Asked Questions
Users understandably have many questions about the data they are using, here are some of the more frequently asked questions about the 2022 release of the National Structure Inventory.
Who can use the NSI data?
NSI 2022 is based on data that was intentionally curated to have less restrictive license agreements than NSI 2019. This allowed for public access to the primary fields in the NSI base data schema. The full NSI (including additional private fields) is available to Federal, State, Local, Tribal, and Territorial Mission Partners who have a signed Data Use Agreement with HIFLD; this includes USACE, FEMA, and other agencies. The public version of the NSI is releasable to the general public as it removes fields that are derived from licensed data.
What do the various field names and data values mean?
Please refer to the NSI Technical Documentation. It provides definitions for each field and character values.
What year do the population and prices represent in the NSI-2022?
Population was indexed to 2020 levels and prices were indexed to 2021. Depending on the analysis year and level of decision-making, it may be important to adjust the values to the present year.
What do the ground elevation fields indicate?
Two fields are available to indicate the structure's ground elevation in both feet and meters. These values were assigned from a 10m NAVD88 grid. For flood consequence estimations, users will want to ensure that any hydraulic data shared the same terrain grid during modeling. If users modify the structure's placement, the fields' value will no longer be applicable.
When will new versions be released?
The NSI Development team hopes to release an update to the NSI on an annual basis, or more frequently, going forward.
Where is data available?
The NSI covers all 50 states and the District of Columbia. Many input data sources were not available for territories such as Puerto Rico; as such, no new data was created for these areas. Some counties and other jurisdictions within covered states may have also been missing data; the NSI generator attempts to fill data gaps whenever possible using lower resolution data.
Why am I seeing strange values in the NSI?
See the common issues section below for specific examples. But users should know that the NSI is generated from numerous datasets that each have their own strengths, weaknesses, and errors. When combining these various datasets, unrealistic or inaccurate estimates may occur. Users should always review the data for their study area and ensure values are appropriate for their own analysis.
How reliable are the provided values within the NSI?
It depends on the level of decision-making and study area. Some localities have richer input datasets than others. Some fields are randomly assigned to structures based on probabilities that vary by several different conditions while others may be derived from structure specific sources such as assessor data. Performing a survey of your study area may help ensure that the inventory is representative of reality.
Known Issues
This section attempts to explain common issues that remain in the dataset, explains how the problems occurred, offers advice on how users may mitigate the issue if necessary, and describes how versions of the NSI Generator may attempt to handle similar issues in the future.
Structures in streams and other odd places

One of the main improvements of the 2022 version of the NSI is the placement of structures within Census blocks. With the incorporation of parcel data and building footprints, most structures are located on the centroid of the high quality building footprints.
However, some data inputs may inaccurately report a structure where none exits. This most often occurs with tax exempt properties and agricultural parcels. The NSI will drop such properties if no building footprint exists within the parcel's polygon, however, this check will not be performed if population was assigned to the structure.
In areas where parcel or ESRI based data is missing, the census block will be backfilled with a previous HAZUS-based version of the NSI. These structures are marked "X" in the source field and may also appear in strange locations if no building footprints exist to improve their locations.
Users should considers manually adjusting the placement of these structures. Deleting the structures may also be appropriate in certain circumstances; however, population assigned to the structure may need to be reassigned elsewhere first depending on the study's purpose and desired level of accuracy.
Future versions of the NSI generator will attempt to address these issues by continually updating input footprint datasets and by adding additional checks to remove false-positive structures.
Missing Structures
The base layer of the NSI-2022 dataset contains roughly 123 million structures. This is slightly lower than some building footprint datasets used by the NSI. Outbuildings in single-family parcels (detached garages, sheds, etc.) are deliberately omitted by the NSI while some structures in non-residential parcels may not be included if we lack supporting information of their use type or other circumstances.
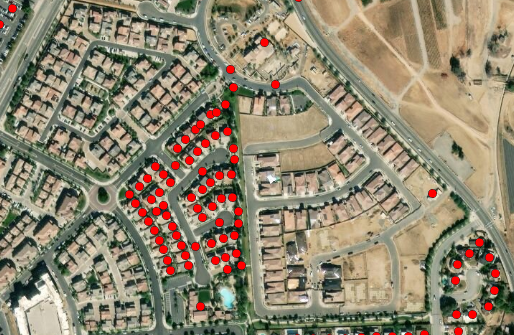
There may be some structures that exist that do not have matching NSI structures; this could be because of any many reasons. In the example figure, the development is more recent than the parcel data available. In this case, users would have to manually create new structures if they wish to account for the development.
It is also possible that the input data did not correctly identify the correct number of structures. For example, a commercial complex may have a single record despite there being several distinct physical structures on the property. In this case, users may need to create new structures and value, or, distribute the value and PAR of existing structures across more spatial locations. In some parcel data, a large residential subdivision may simply be recorded as a single "Single Family Residence."
The NSI generator attempts to recognize and address these issues by using building footprints to recognize when multiple structures may exist within a single parcel. However, it is not always successful, either because footprints may be missing for some structures or due to weaknesses in the quality checks.
Users should perform their own quality control and ensure there is adequate representation of the at-risk inventory. Future versions of the NSI will update its footprint datasets and add new logic to recognize potential false-negatives.
Structures Reporting Unrealistic Number of Stories

The NSI estimates each structure's number of stories individually. For single-family residences this process is relatively simple: most structures have their number of stories recorded within the parcel data. If the parcel data lacks a number of stories value then it may be estimated by dividing reported square footage by the estimated occupied footprint of the structure. If the input data lacks both of these fields, then number of stories is randomly assigned from a distribution based on the structure's census region and year built.
For other types of structures the process is more complicated, but it is ultimately decided by two main factors: 1) the estimated square footage that a structure needs to accommodate the stated number of residential units or employees, and 2) the estimated footprint size of the structure. If the square footage estimate is too large, or if the footprint size is too small, then then the NSI Generator will estimate that the structure is taller than it actually is. In the example above, the available Esri and LEHD both suggested the building had ~10,000 employees; however, the building was actually a staffing office for nurses that work offsite.
The NSI generator will cap number of stories at a more reasonable value if Lidar based footprints are available for the structure. These footprints (the footprint source field will read NGA or MBL) record the building's height and were often used with a height per floor assumption to correct issues with other methods.
For life safety purposes, the poor estimate of number of stories might not always matter. Regardless of whether a structure is 5 stories or 50 stories, few floods are likely to submerge it. However, being two stories instead of one may matter for that particular structure's occupants. Further, if the number of stories estimate is off by a substantial degree, it is likely that the square footage and structure value is also poorly estimated and may need to be corrected for economic damage focused studies.
Future versions of the NSI Generator will attempt to address this issue by integrating more Lidar based footprints as they become available and shifting to a multi-variate approach for number of stories estimation.
Structures underrepresenting population
The NSI Generator assigns population to structures from separate residential and commercial pools. Residential structures can be assigned population from census block population estimates, and commercial structures are assigned from LEHD census block estimates of workers. Structures with more housing units or more employees (as indicated primarily by ESRI business layer data) are assigned a greater portion of the census block population.
With few exceptions, no pools exists for customers, visitors, or others that would not represented by the worker or residential pools. Exceptions include students at K-12 facilities and hospital patients at facilities with recorded bed counts.
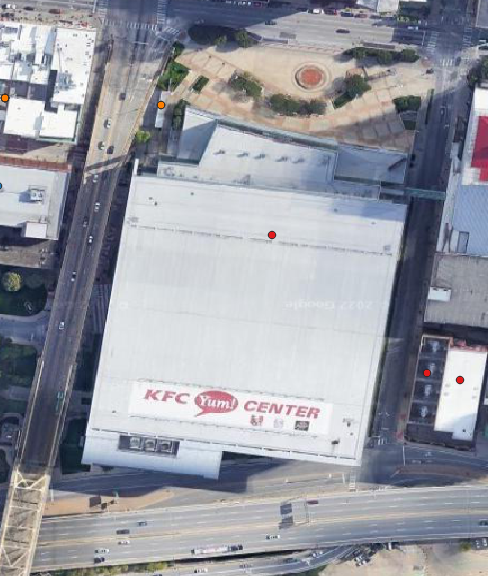
However, large recreational structures, such as arenas, and businesses such as hotels may be under represented in NSI estimates of their at-risk populations. If such structures represent a significant portion of the at-risk inventory, analysts should consider making their own adjustments to the structures. However, it is advised that analysts consider the likelihood of populations being at the structure at the time of the flood. For instance, a sports arena may at times see 20,000 fans occupying the building, but they may do so only a few dozen times throughout the year and games may be cancelled if an unprecedent flood is forecasted.
Future versions of the NSI will attempt to address these weakness by updating input census data and by creating a new customer/guest pool based on an analysis of American Time Use Survey Data that hotels and others may pull from (the "Surplus" field in the Private version of the NSI is reserved for this purpose) while reducing the population in residences.
Structures with Inaccurate Portrayal of Depreciation

Depreciated replacement value is used in place of market value to comply with USACE guidance (P&G, pg E-99&100, and other sources). Depreciated replacement value is intended as a measure of what could be damaged by a flood, rather than what a buyer may be willing to pay for a property. As such, depreciated replacement value may differ significantly from market value, particularly in areas where housing is in short supply and land costs are extremely expensive.
Depreciated replacement value in the NSI-2022 is assigned by multiplying a dollar per SqFt value that varies with building type and size by the total square footage of the building and a depreciation factor. Depreciation is solely estimated by decreasing the value of the structure by one percentage point per year for up to 20 years.
However, structures may be more or less depreciated than assumed. Depreciation may stem from deferred maintenance to the structure or from other sources. Depending on an user's intent, other sources of depreciation, such as economic depreciation, may also be inaccurately omitted.
Users should consider conducting a survey of their study area and adjusting structure values to suit their purpose and to reflect the status of the built environment.
Future versions of the NSI Generator may be updated to use information such as assessed value or vacancy indicators to adjust replacement values.
Structures with Improper Foundation Heights and No Uncertainty
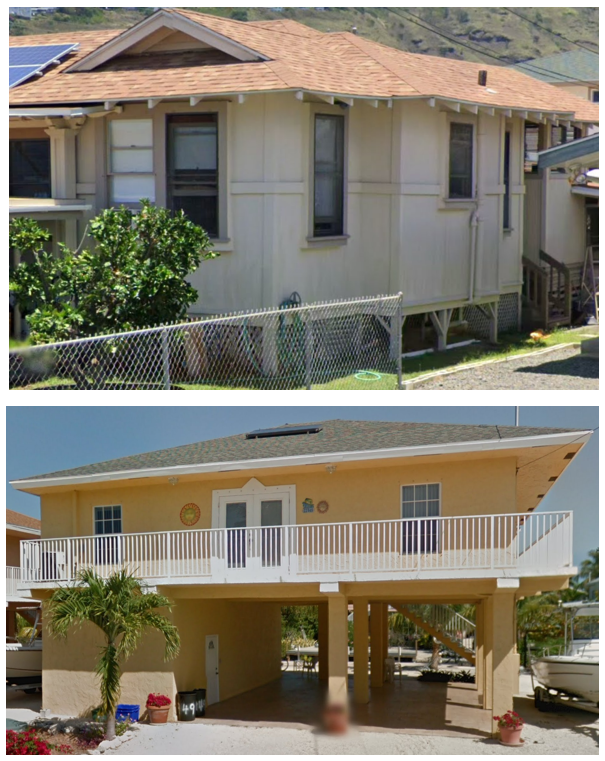
Foundation heights are often a driving assumption for economic damages. It can be critical to not only assume the correct mean and standard deviation within a study area, but also to reduce structure level error.
The NSI attempts to achieve structure level accuracy by making foundation height assumptions that are based on each structure's foundation type. However, this data is not always available, and there is often a range of heights for structures with similar foundation types.
When there is no structure specific data for foundation types, the NSI assigns a type based on a distribution that varies with 1) different Census regions, 2) Riverine vs Coastal areas, 3) A and V zones within coastal areas, and 4) whether the structure was built before or after NFIP entry.
Nonetheless, distributions can vary within these groupings and substantial structure level and aggregate level error may persist. Users should do due diligence to ensure that the assumed distributions are reasonable for their study area and level of decision-making. Furthermore, users should ensure that any individual structures that may have a significant effect on the overall results have accurate attributes.
The NSI Survey Tool will be made available to USACE study teams to help with this process. Users outside of USACE are advised to conduct their own surveys for their study area, to update their inventory based on the results, and to capture any remaining uncertainty within their consequence models.
Future versions of the NSI Generator will attempt to address these issue by varying foundation heights for a given type based on other factors, such as the region and base flood elevation. Additional fields may also be added that indicate a likely range for fields such as foundation height, rather than a single most likely estimate.