Download PDF
Download page Viewing Sediment Results in RASMapper.
Viewing Sediment Results in RASMapper
HEC-RAS and RASMapper do not write sediment results by default. The default results include Depth, Velocity, and Water Surface Elevation (WSE). Users must add sediment results to the Results tab like they would add any other hydraulic parameters. Expand the Results node in the RASMapper tree. Each simulated plan has a node under Results. Right click on the plan and select Create a New RAS Map Layer to add variables.

Figure 1. Right click on the Plan Description under Results and Select Create a New Results Map Layer to add Sediment results (or non-default hydraulic results).
The Results Map Parameters editor has two main Map Types: Hydraulics and Sediment. Expand the Sediment tree in the left pane of the editor to see the available sediment parameters. The figure below includes the default sediment results avialble. Select additional 2D sediment results by selecting Customized Variables in the Sediment Output Options menu.

Figure 2. Two types of sediment results (Bed and Transport) in the Results Map Parameter editor.
2D sediment maps fall into two main catagories: Sediment Bed Maps and Sediment Transport Maps. Sediment Bed maps include results like bed change, bed elevation, bed gradation, and other bed properties. Sediment Transport includes results like concentration, capacity, and other results dynamic, water column or flux results. Any results that HEC-RAS also computes by grain class will also include an expandable tree of results (like Total-load Concentration in the example above). Select the variable node (e.g. Total-load Concentraiton in the example above) to add the Total and all the grain classes to RASMapper. Or, click on one of the sub nodes (e.g. Total, VFG, MG) to add only the total or only one grain class at at time. In the example bleow the user added Bed Change and all of the Total-load Concentration results but is only diplaying the Fine Gravel Concentration (FG).
Simply clicking the checkbox to turn sediment results on often does not display any results because sediment reuluts are often not initialized in the first time step.
Use the animation bar to view results through time. ![]()

Figure 3. Example use of the animation bar to view sediment concentrations in time.
HEC-RAS 6.0 cannot plot cell face results yet.
Modeling Note – Subgrid Visualization - Because the 2D model updates the bed on the subgrid scale but RAS Mapper does not display subgrid results yet, RAS Mapper will map average results over the wet, dry, or total cell. "Wet" cell results will average the bed properties and bed change properties from the sub-grid portions of the cell below the computed water surface elevation and "dry" results plot the sub-grid results for the cell above the computed water surface. Sediment bed results that are not specified as wet or dry average results over the whole cell.
After adding the map or maps, Close the Parameter Selection editor. The selected map(s) should appear under the plan heading in the Results node (see Figure below). It is almost always useful to edit the default color ramp to visualize sediment results, and there are some standard practices for some variables. To edit layer properties, right click on the map and select Layer Properties (see figure below). ![]()
This will launch the Layer Properties editor (see figure below). To edit the color ramp press the Edit button under Surface.
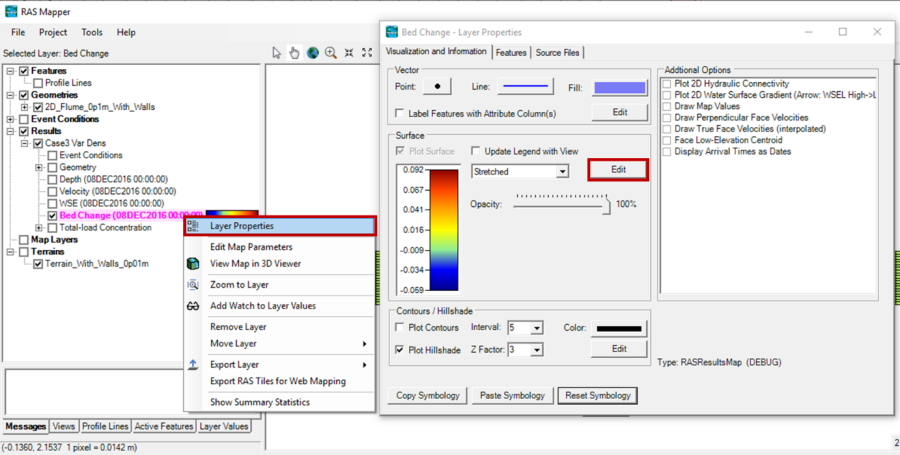
Figure 4. To edit the color ramp and display properties of the sediment maps, right click on the map and select Layer Properties. Then Click Edit under the Surface menu.
RAS Mapper includes a standard Bed Change color ramp designed to display this common sediment result map (see figure below). However, this display works best if it is symmetrical, where white is "no/minor change" and aggradation and degradation get their own colors. To make bed change symmetrical, turn of the Use Dataset Min/Max to make the Min and Max editable, and then set them both equal to whichever value is larger, making sure to keep the Min negative (e.g. if the Max in the example below is 0.091 and the Min is -0.073, set the Min to -0.091 to make the bed change display symmetrical).

Figure 5. Setting the Max and Min to equal values (whichever abolute value is larger) with opposite signs, centers the Bed Change plot, making all depsoitin and erosion the same colors and the range of no change white.
RAS Mapper has two default sediment color maps: Bed Change and Concentration. ![]()
Modelers will develop preferred color ramps and visualization approaches. RAS Mapper allows users to add customized color ramps and visualization parameters to the color ramp editor (see figure below). Edit the color ramp to optimize the visualization, then press Save Color Ramp. Give the customized color ramp a name, and it will show up at the bottom of the color ramp list for any result in this project.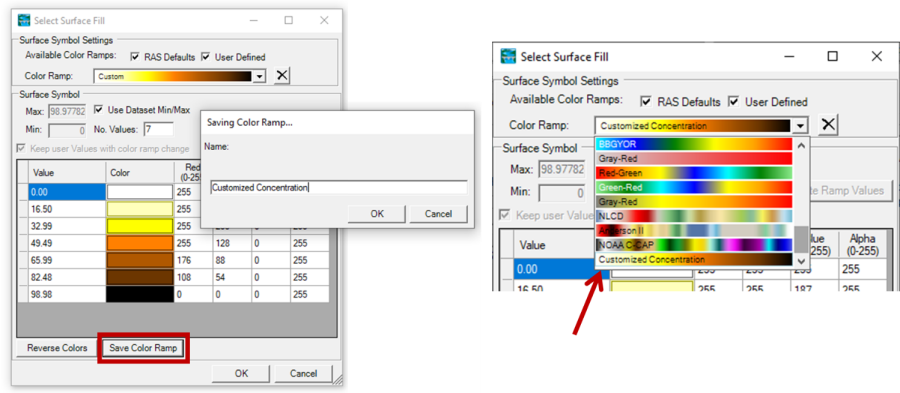
Figure 6. Save customized sediment color ramps that persist throughout the project with the Save Color Ramp button.
Users can also view time series of sediment data across a cell face or a reference line or a profile of sediment results along a profile line. More on those approaches are here: