Download PDF
Download page Troubleshooting a 2D Model.
Troubleshooting a 2D Model

Objective
This workshop will help students learn how to troubleshoot 2D model instability problems and excessive model iteration issues within HEC-RAS. This workshop contains (at least) five major issues, which are to be solved by the student. However, there may also be other minor issues with this model. While the data is from actual studies, the models and results of this workshop do not represent current or future conditions of the rivers.
Background
The stream for this example is a section of Bald Eagle Creek located near Lock Haven, PA. The model includes the portion of the river downstream of Sayers Dam and goes down to the confluence with the West Branch of the Susquehanna River. The town of Lock Haven is protected by a levee system. For the event being modeled, the levee should not be overtopped.
The project has already been run for you. Examine the output for instabilities and excessive model iteration issues. Remember the steps discussed at the end of the Troubleshooting lecture for how to fix modeling Issues. Based on the output (including the runtime messages and HEC-RAS Mapper output), geometry, boundary conditions, and computational settings, form a hypothesis on what is causing the instabilities and excessive model iterations.
- Revise the model based on what you find in your investigations of the model.
- Rerun the model.
- Review the model and continue improving it until you achieve a stable and computationally efficient model (i.e. a model with few model iterations and low computational errors).
Tasks
- Open the project.
- From the Unsteady Flow Analysis window, select the Options | View Runtime Messages menu item.
Start by reviewing these messages. - Make a note of the following information:
- Overall Volume Accounting Error as a percentage
- The Maximum cell wsel error
- Unsteady Flow Computations time
- Cell numbers that have large errors and/or excessive iteration issues.
- Go to HEC-RAS Mapper and create the following New Results Map Layers to help you find model instability errors and excessive model iteration issues:
- Cumulative Max Iterations
- Maximum Water Surface Error
- Review the results in HEC-RAS Mapper by looking and these two new maps, as well as the Depth, Velocity, and WSE map layers.
- Use the HEC-RAS Hydrograph plotter to review computed stage and flow hydrographs for the SA/2D Connections and the SA/2D Flow Area – BC Lines.
- Based on your review of all this information, make decisions on what needs to be changed in the model, make the changes, rerun the model, then repeat the process until you have achieved a stable and computationally efficient model (i.e. a model with few model iterations and low computational errors). It's best to not to make too many changes at once. Some errors may be compounding and may not occur if certain issues are addressed first.
Questions
- After each Model run make note of the following:
- Unsteady Flow Computations time
- Overall Volume Accounting Error as a percentage
- The Maximum cell wsel error
- Cell numbers that have large errors and/or excessive iteration issues.
- For each model run, identify what you thought was the biggest problem/issue and how you fixed it
The run uses the SWE-ELM equation set. Model runtime is about 5min.
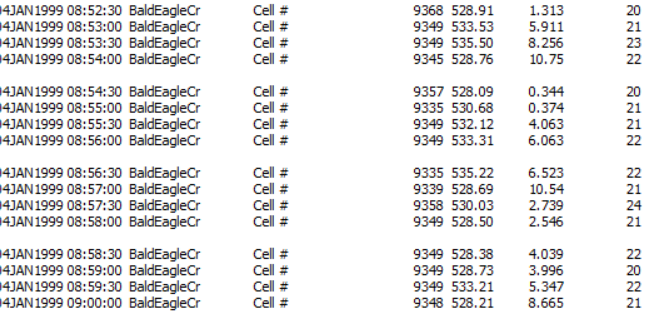
The initial run iterates significantly with many lots of iterations >1ft of water surface error. One particular cell does not stand out as "the" cell - multiple cells have bad convergence. There are thousands of messages where RAS is going to Max Iterations, as shown below. Cells around 9349 problematic (many in the 93xx area).
Overall volume accounting is not bad, 0.006%. However the Max WS Error is large at around 15ft!
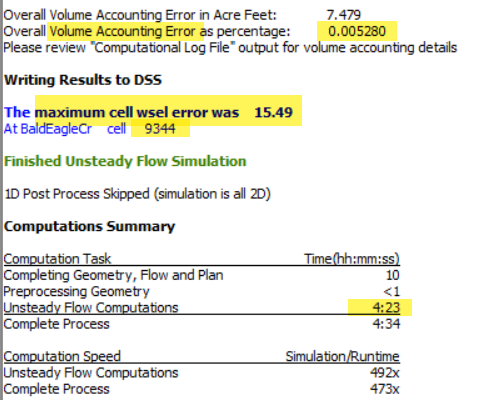
- Model runtime - 4.5min (model runtimes will be computer dependent)
- Overall volume error - 0.005%
- Max cell wsel error - 15ft at cell 9344
- Iteration issues - many, especially in the 93## range
After evaluating the computation messages, use the RAS Mapping capabilities to understand where the problems are occurring.
Max Velocity Mapping - the velocity map show very high velocities in select locations (at the dam, several places in the channel, and at the downstream boundary).

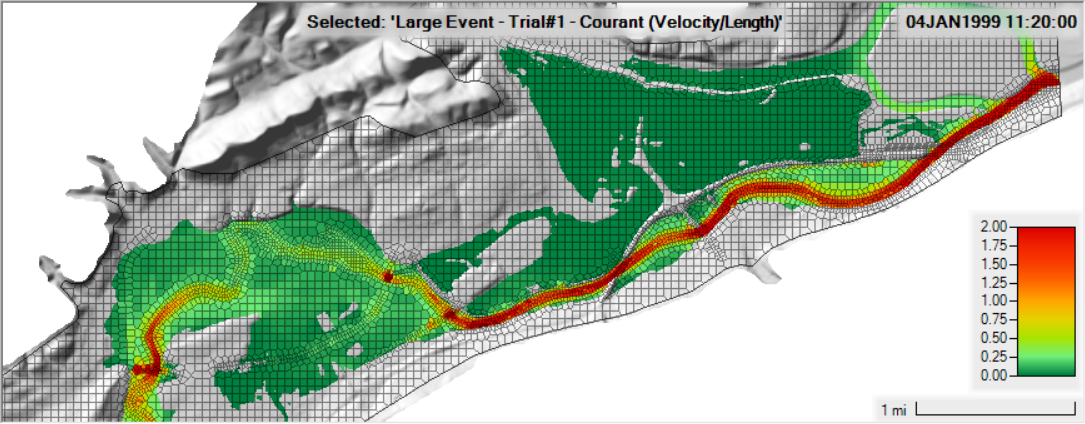
Courant Mapping - the courant map shows high values (>2) for much of the channel.
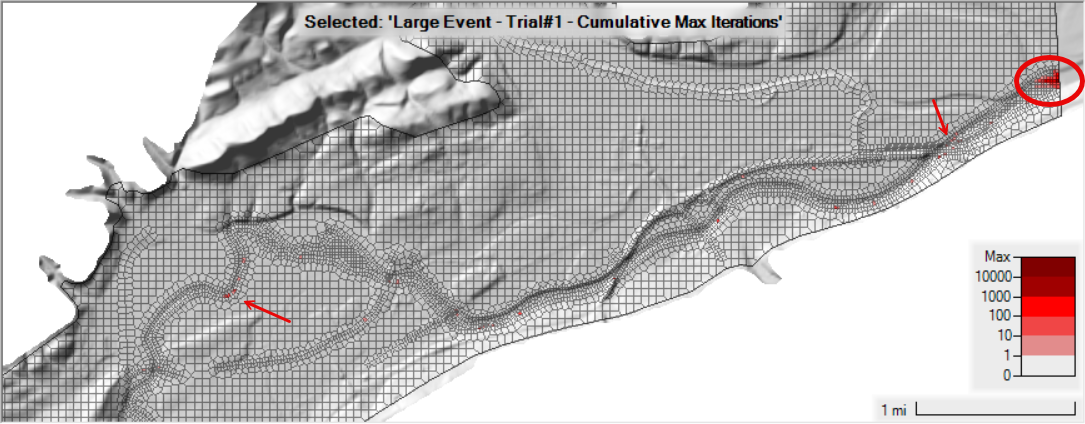
Cumulative Max Iterations - the model is iterating significantly, but the majority of iterations are near the downstream boundary.
Max Water Surface Error - the max water surface errors happen throughout the model, but is dominant near the downstream boundary.

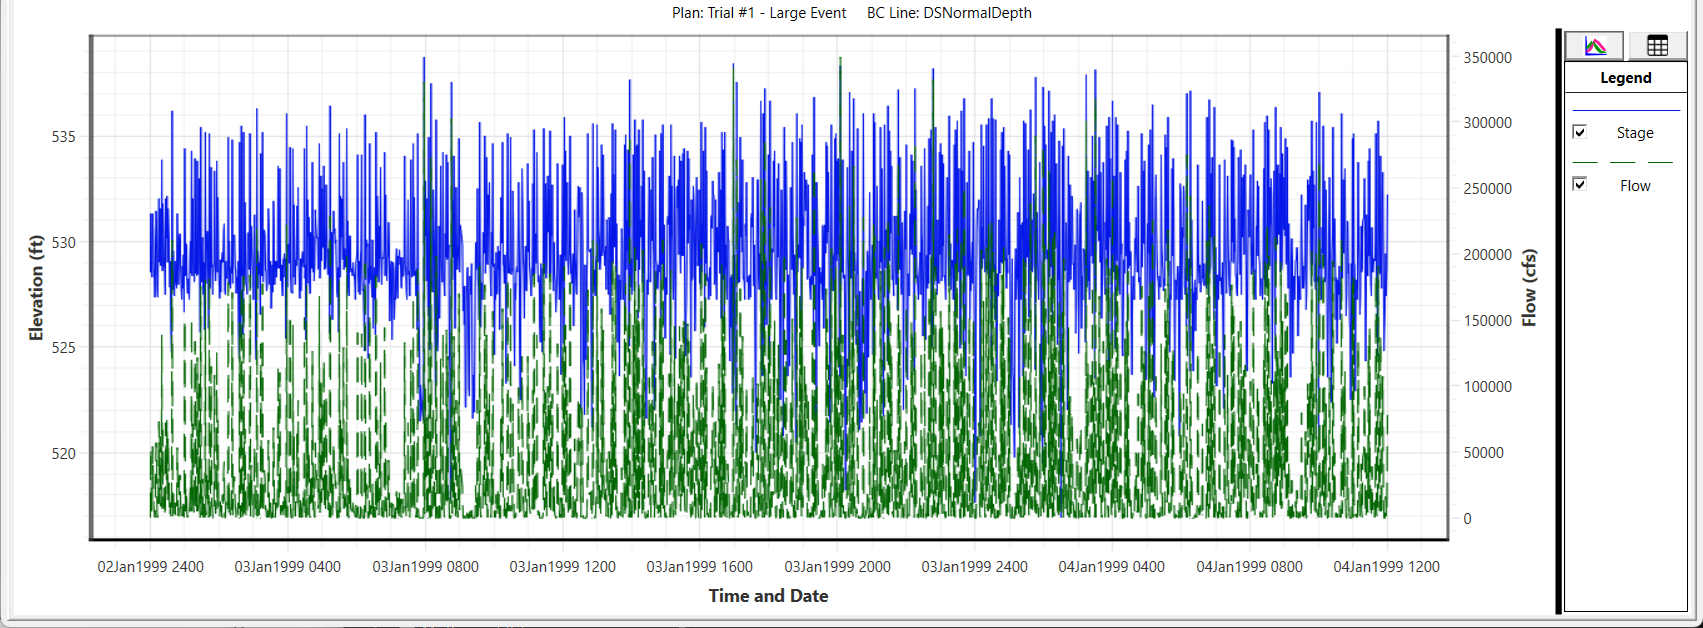
Downstream Boundary Condition - the hydrograph plot for the downstream boundary condition looks awful. This indicates an highly unstable model. We'd like to see a "smooth" hydrograph!
From the initial investigations shown above, we can draw a few conclusions. (1) it appears that the selected computation time step (30s) is too long and (2) there is something going poorly at the downstream boundary.
- Time step - too large a time step is indicated by the high Courant number in the channel (>2.0) which for the SWE we want to keep the Courant near 1.0. There are 100ft cells in the channel and investigation of cell velocities show a max velocity near 10 ft/s. Therefore, we should be using a computational time step of approximately 10s. This will most likely result in longer run times; however, it will be offset by less iterations.
- To compute and appropriate time step use: ΔT ≤ ΔX/V or 100ft/10ft/s = 10s
- Downstream Boundary Condition - the Normal Depth boundary condition is being used for the downstream boundary. The Slope select was 0.2. This appears very steep. To find a reasonable estimate of the energy slope, you can use the ground slope or the water surface slope at the boundary. Using the Measure Tool in RAS Mapper to measure the slope of the terrain in the channel near the downstream end of the model, we find a slope of 0.0006 would be more appropriate.
Set the Computation Interval to 30s and the Slope for the Normal Depth Boundary Condition to 0.0006.
For Trial #2, the time step was changed to 10s and the downstream boundary conditions was changed to use a normal depth slope of 0.0006.
- Model runtime - 5.5min
- Overall volume error - 0.0001%
- Max cell wsel error - 1.6ft at cell 13734
- Iteration issues - many
The downstream boundary and time step appear to have improved the solution. The model iterated less and Courant numbers look reasonable. However, a WSE error of 1.6ft is unreasonable for a good solution.
Looking at the messages, we can find cells where RAS went to max iterations. There are also messages about culverts and weirs.

Note the the max wse error occurred at the culvert.
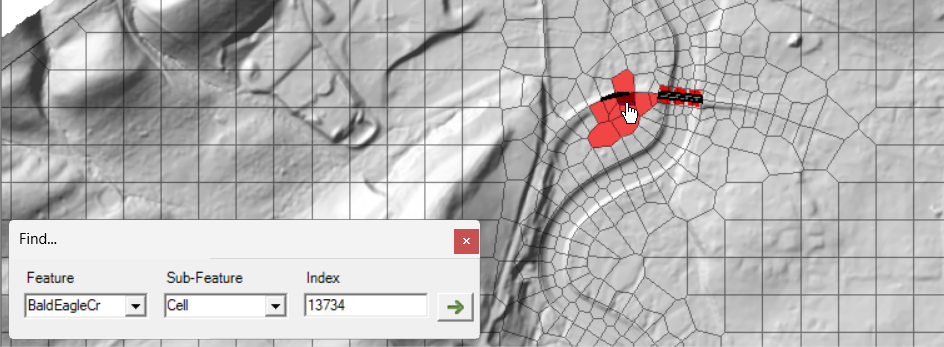
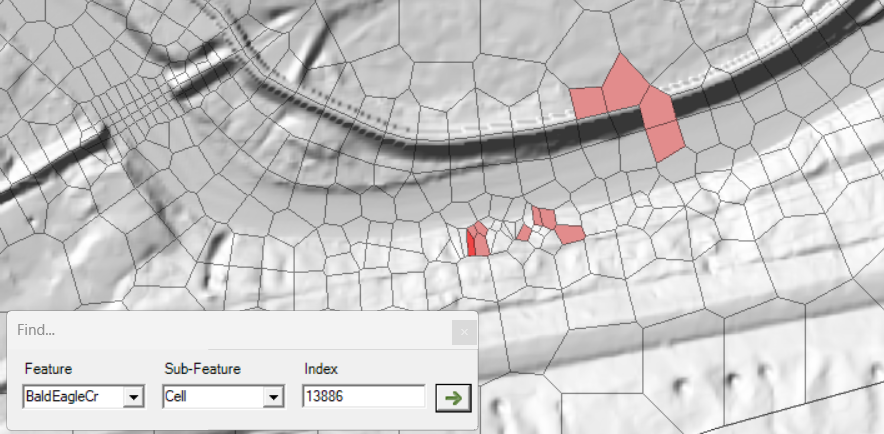
The model has significant max water surface elevation error (at cell 13734). Cell 13734 is also significant for max iterations. To find this cell, go to the Results | Trial #2 | Geometry | 2D Flow Area layer and press Ctrl+F to open the Find dialog. Type in cell 13734 and press the Arrow button - RAS Mapper will zoom to the location of interest. In the figure below, the Max Water Surface Error layer is also turned on (which could have also keyed you in.)
We must turn on the Geometry to get a better handle on what is going on in this area (and zoom in).
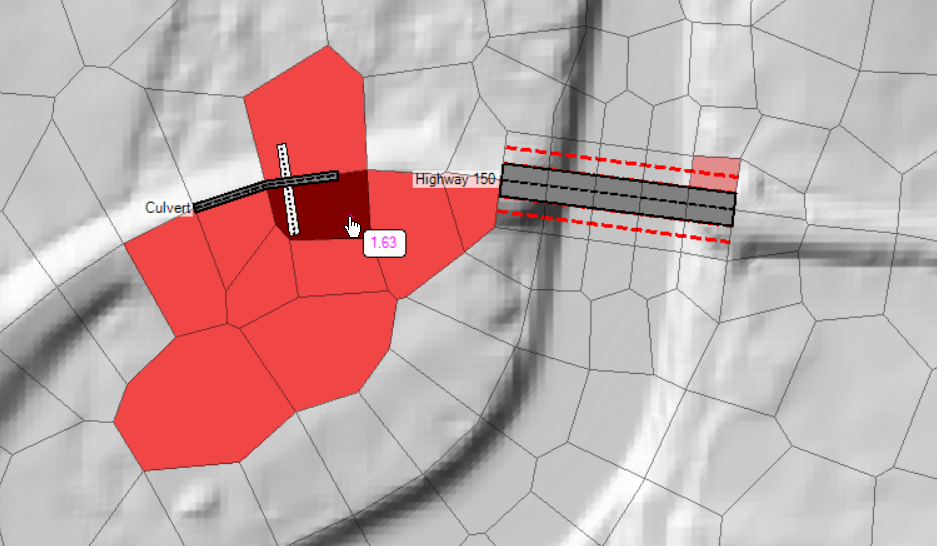
We can see the WSE error in this area is high and it is at a culvert. The Computation Messaging informed us that the culvert was BELOW the invert of the cells it is connected to (below ground) and, therefore, would be physically be partially blocked as far as the elevation at which flow would enter or leave the culvert. (HEC-RAS assumes the part of the culvert below the ground can flow full and empties to the cell minimum elevation based on the water surface elevation, which would be higher that the culvert invert). This can result in model iterations and, in this case, large errors. Mapping Maximum Water Surface Error or Cumulative Max Iterations layers, you can see this area has significant problems.
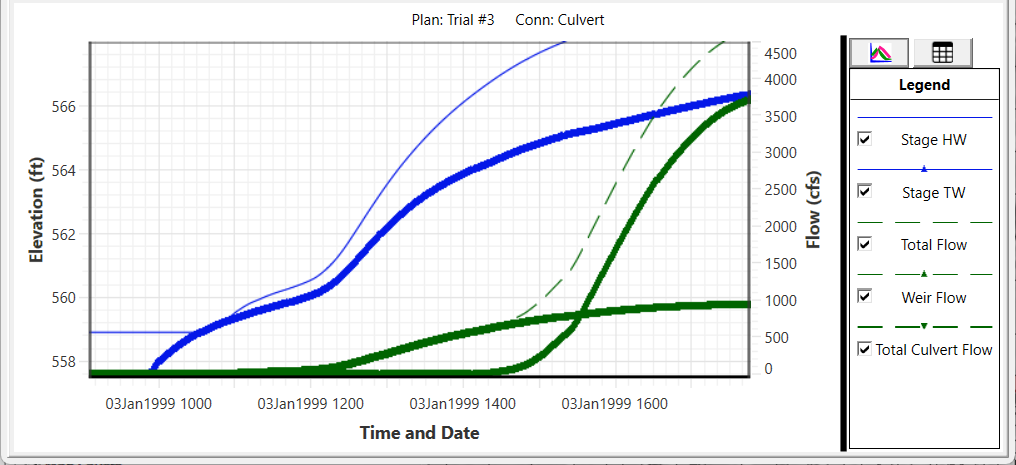
Using the hydrograph plot, you can see the culvert is unstable as it begins to flow.
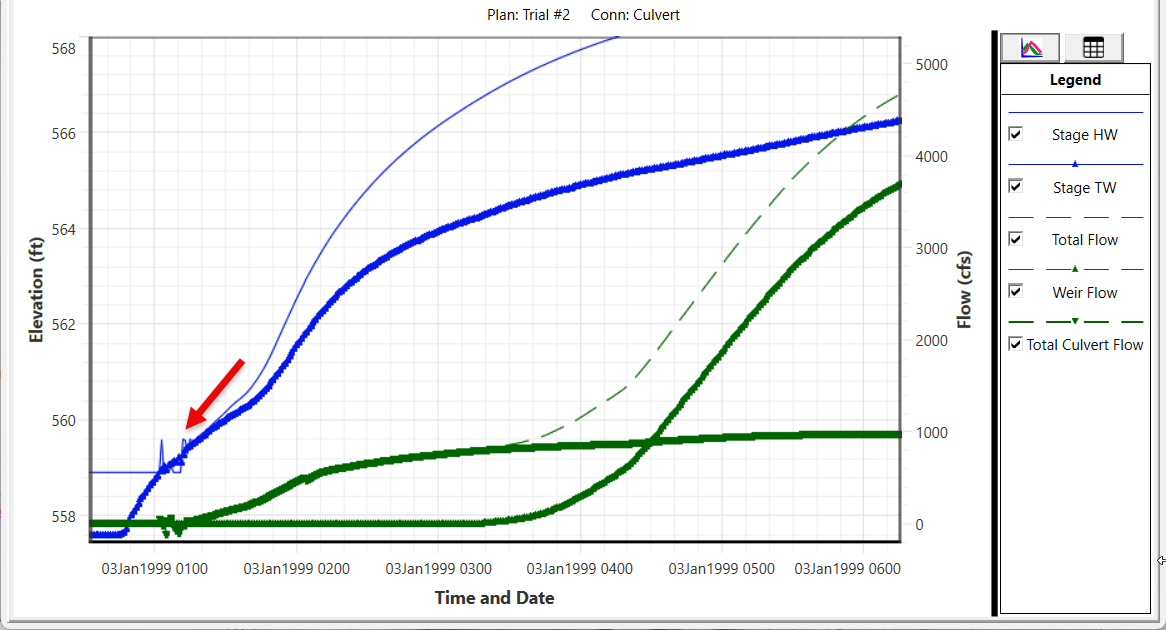
As shown in the figure below, the culvert is approximated 3ft below the cell invert on both the upstream and downstream sides. The culvert was improved by raising the invert to the cell minimum elevation.
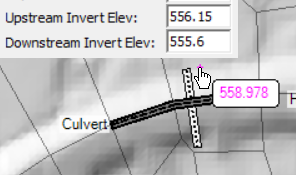
The cells for the inlet and outlet of the culvert could also be made larger by moving computation points. This would allow for the elevation-volume curve to have more smaller changes water surface elevations as the volume changes in the cell and likely result in a more stable model.
For Trial #3, the culvert invert elevations were adjusted to the minimum cell elevation in the inlet/outlet cells.
- Model runtime - 5.5min
- Overall volume error - 0.00001%
- Max cell wsel error - 0.6ft
- Iteration issues - many, cell 13886 (and 13889) looks problematic
The culvert no longer appears unstable.
For Trial #3, we have not significantly improved run times. This is frustrating, as we have solved several problems.
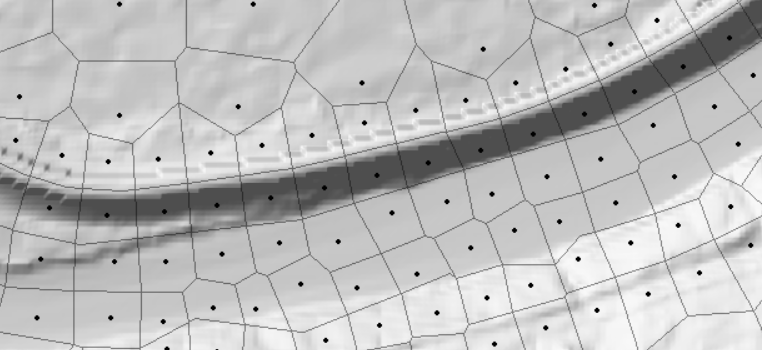
One particular cell appears to be iterating, even after the peak of the floodwave passes. Zooming in to this cell, we can see a mess of small cells on the south side of the channel downstream of the Railroad Bridge. This mesh is poorly developed and needs improvement.
Turning on the Maximum Water Surface Error layer indicates the cells that are causing the model to iterate.
You can also see that there are two cells on the north side of the channel that do not have faces along the high ground of the levee. This is allowing water to pass through the levee and is a mesh development mistake.
The cells in the channel were improved to be perpendicular to flow and of consistent spacing. The cells spanning the levee were adjusted to not allow water across the high ground.
There are other cells that could be improved due to iterations and errors (14151 showed the max ws error). We fix those in the next iteration of fixes.
Channel cells were aligned with flow and small cells were removed. Leaky cells were fixed by aligning cell faces with high ground at the levee.
- Model runtime - 4min
- Overall volume error - <0.0001%
- Max cell wsel error - 0.5ft
- Iteration issues - many, cell 9202 looks problematic
Model run time has decreased. However, there is still considerable cell wse iteration.
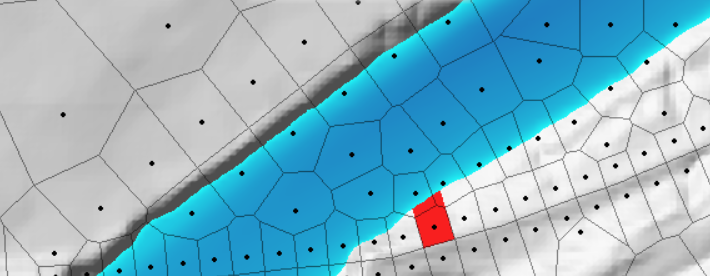
Cell 9202 is going to max iterations. Zooming to that cell and evaluating, we see the cells are not aligned with flow. Flow is passing through the corners of the cells. This is causing the model to iterate.
Adding additional cells to align flow will decrease model iterations.
Max ws error was happening at cell 14141. Again, this is due to poorly aligned cells.
There are still many cells that are iterating. Use the Cumulative Max Iterations or Maximum WS Error map to find "hot" spots. You will see several of the bridges have large water surface error compared with the other cells in the system. They will need to be examined.
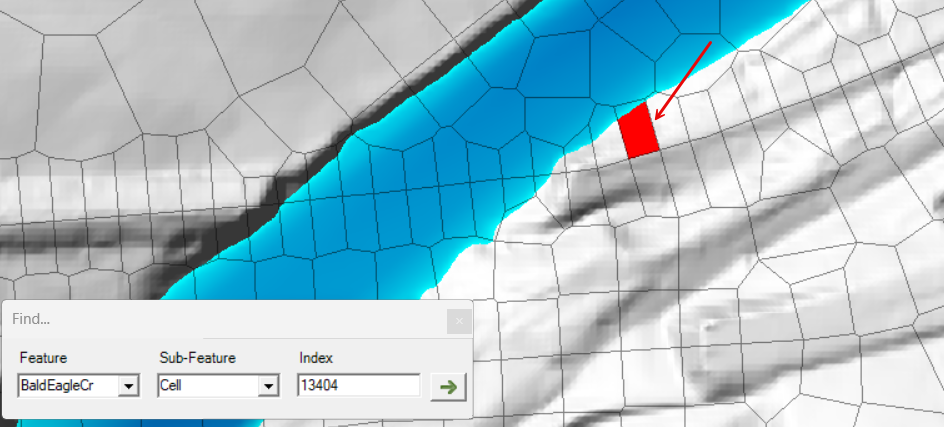
Cell alignment was improved for the channel for cell 13404.
You can chase down the other cells that go to max iteration individually, or you can use the Cumulative Max Iterations map.
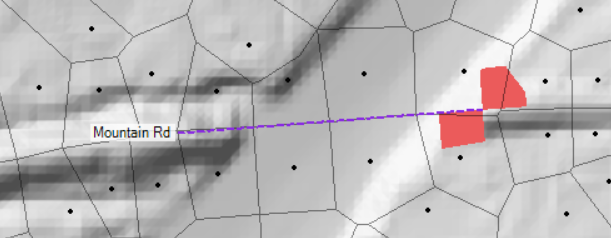
Cell 17905 is one of the first cells to go to max iterations. This cell is around the Mountain Rd bridge. The max error here was not large (<0.03ft), but we can improve the solution by improving the mesh. The errors are due to partial wetting of the cells much like the channel cells discussed above.
Larger cells around the bridge will increase model stability.
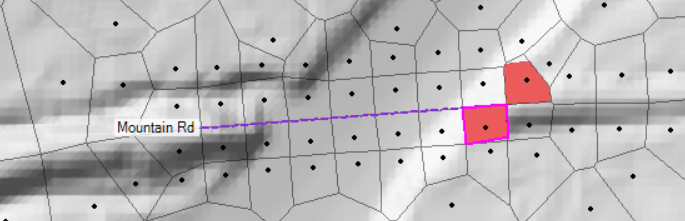
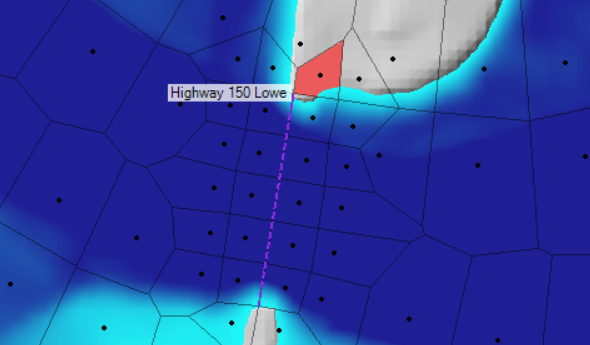
A similar issue was occurring at the Highway 150 Lower bridge. A cell near the bridge is going to max iterations due to the corner wetting. The water surface error is significant for this cell (~0.4ft).
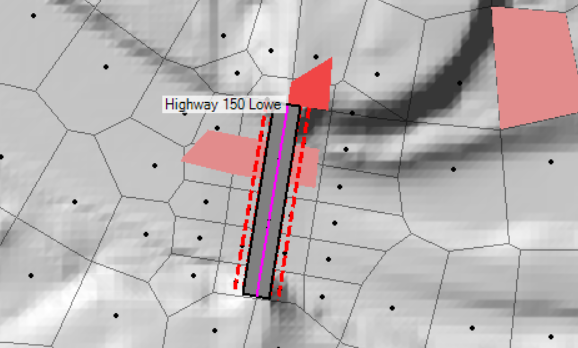
To fix this issue, the bridge needs to fully span to high ground. The bridge span was lengthened. The bridge was then enforced as a breakline and the points around the bridge were moved to create a good computational mesh. Shown below are the changes with the old cell's, that had errors, shown in red.
After extracting new geometry for the bridge, we will need to update the data.
- First, is the profile data.
- Then from the Geometric Schematic, we need to update the weir data and the bank station data.
The Highway 120 Upper bridge has similar iteration problems and can be improved.
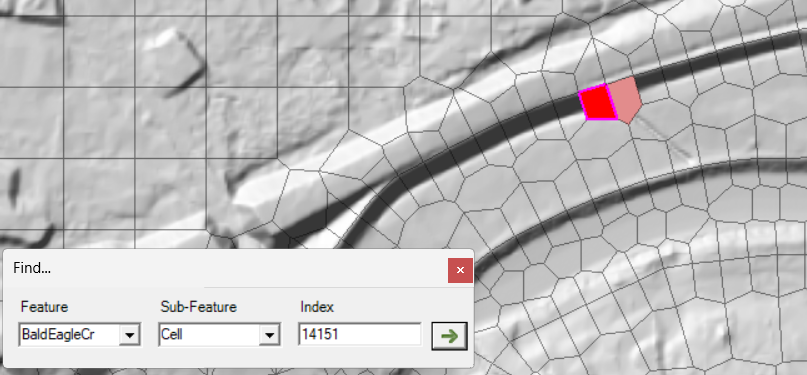
Lastly, the largest water surface error is occurring at a cell in the channel (14151). The error is higher than we would like (~0.4ft).

Improving the mesh in this area will help reduce iterations and errors in water surface.
At this point, the model is running much faster, more stable, with very small water surface error.
- Model runtime - 3min
- Overall volume error - <0.000001%
- Max cell wsel error - 0.05ft
- Iteration issues - just a few bad cells
This is a vast improvement on the original model. However, we can always make the model better.
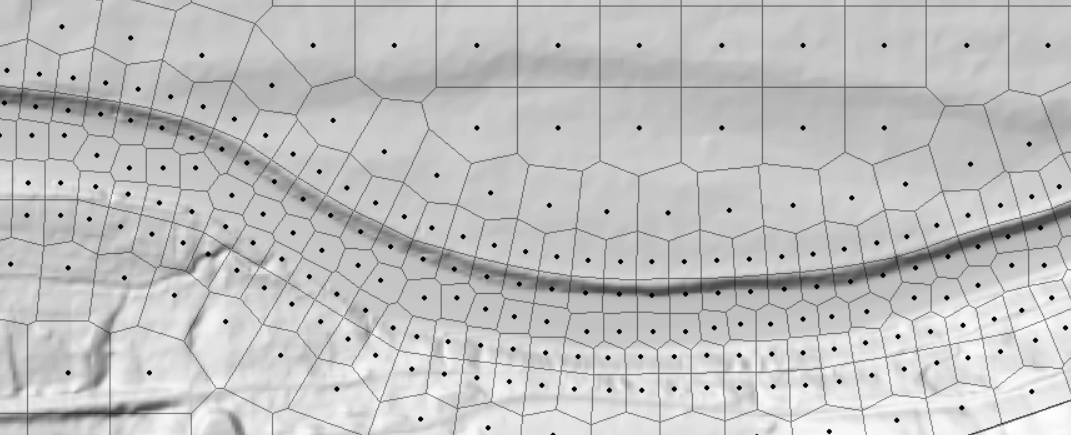
The mesh in the channel is actually pretty poor near the downstream. The sparse computation points can be seen by turning off the cell faces.

Improvement of the mesh would include adding computation points an aligning faces with flow.
We see there are still iteration errors. In this case, these is one more bridge that could use clean up. The other cell that is iterating is the upstream boundary.
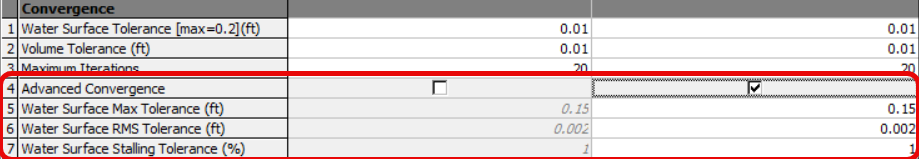
Sometimes these iterations are in areas that don't affect model results or the iterations don't improve the solution. When iterating doesn't improve the solution, we can turn on the Advanced Convergence criteria. This will halt the iterations, if the iterations are not improving on the solution. This option is available from the Computation Options and Tolerances | 2D Flow Options tab.
The final run of this model using the Advanced Convergence criteria resulted in a find run time of approximately 3min. Turning on the Advanced Convergence criteria earlier in the analysis may have allow early trials to run faster. However, it is important to identify where and understand why your model is iterating.
The model is running in a stable and efficient manner due to the incremental improvements made.