Download PDF
Download page Modeling Bridges Inside 2D Flow Areas.
Modeling Bridges Inside 2D Flow Areas
Users can model bridges directly inside of 2D flow areas. Bridges inside of 2D flow areas can handle the full range of flow regimes, from low flow to pressure flow, and combined pressure flow and flow going over top of the bridge deck or roadway. Users enter bridge data inside of 2D Flow Areas similarly to the modeling of bridges in a 1D model. Additionally, users have the same low flow (energy, momentum, and Yarnell) and high flow (energy and pressure/weir) bridge modeling approaches available for 1D bridge modeling (except the WSPRO low flow method is not available for 2D modeling).
The HEC-RAS software takes the user input bridge data and modeling approaches, then develops a family of rating curves for the bridge, just as is does for 1D modeling. However, for 2D modeling, the bridge’s curves are used to obtain a water surface difference through the bridge for each set of cells being used to model the bridge. This water surface difference is then equated to a force. That force is distributed and put into a special version of the momentum equation for each set of cells spanning the bridge centerline. So instead of calculating friction forces, pressure forces, and spatial acceleration forces, these forces are obtained from the bridge curves. Then the 2D equations are solved as they are normally solved at any cell/face in the model. This approach used for 2D modeling allows for equivalent forces to be computed for low flow, pressure flow, and combined pressure flow/weir flow, or even low flow/weir flow.
The amount of force given to each cell is based on the percentage of the total flow passing through that particular set of cells. This 2D modeling approach allows for varying flow, water surface, and velocity at each of the cells around the centerline of the bridge opening. Therefore, the flow is still computed as two-dimensional flow through and over top of the bridge. Flow can pass at any angle through the bridge opening based on the hydraulics of the flow and the number of cells being used to represent the bridge opening.
To model a bridge inside of a 2D Flow Area, the SA/2D Area Conn geometry drawing tool is used. The basic steps for adding a bridge to a 2D model are the following:
- Draw a centerline for the bridge opening/embankment using the SA/2D Area Conn drawing tool in the Geometric Data editor, or by using the editing tools in RAS Mapper. The bridge centerline must be drawn from left to right looking downstream.
- Develop an appropriate mesh (cell size and orientation) for the bridge, using the structure mesh controls. Some hand editing may be required depending on the bridge and what else is near the bridge (i.e., levee, another bridge, railroad tracks, road, etc…)
- Enter the bridge data (deck and roadway; distance from upstream bridge deck to outside cross section’s piers; abutments; bridge modeling approach; Manning’s n values for the 1D bridge cross sections; and hydraulic tables controls (HTAB) into the SA/2D Area Conn editor.
- Pre-process the geometry to create the bridge curves. Review the bridge family of rating curves for hydraulic accuracy.
Run the model and review the results. Make any necessary changes to the data to improve the results.
Draw the Bridge Centerline
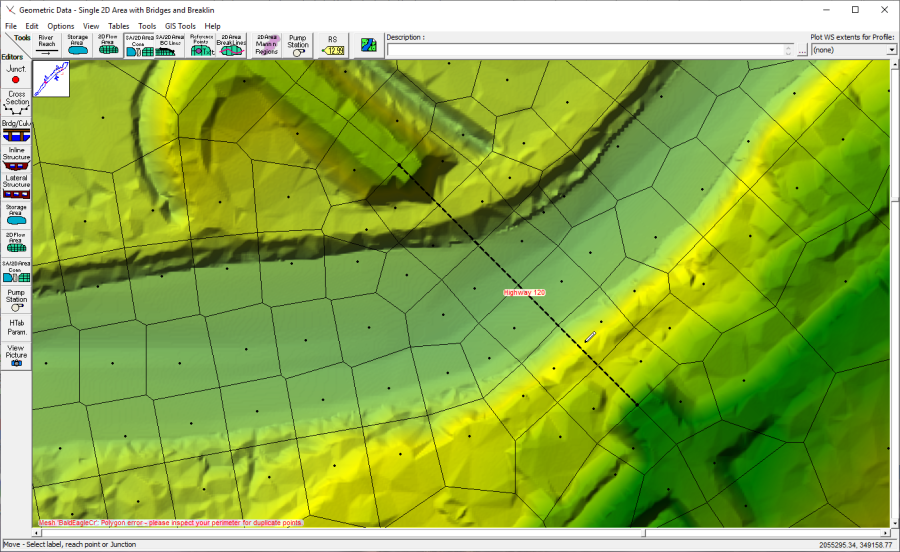
To add a bridge inside of a 2D flow area, open the Geometric Data editor (accessed from the HEC-RAS main window by clicking the Edit | Geometric Data menu command) and select the SA/2D Area Conn drawing tool (Figure 3-49), from the tool bar across the top of the editor. Draw the centerline of the bridge from left to right looking downstream. In the example shown in Figure 3-49, the bridge centerline is only laid out for the bridge opening.
The user has the choice of just modeling the main bridge opening with this structure (including the bridge abutments), or also including the entire road embankment (left and right of the bridge opening). If the approaches for the entire roadway are included in the structure, then the family of rating curves will include flow over the left and right roadway approaches, as well as flow through and over the bridge. However, if the user chooses to model just the main bridge opening with the structure, then the family of bridge rating curves will only include flow going through and over the main bridge opening.
The left and right embankments can be modelled as either normal 2D flow cells and faces (solving the general 2D equations), or separate hydraulic structures can be laid out for the left and right roadway approaches. Using separate hydraulic structures for the roadway approaches allows the user to change the elevation of the roadway, instead of using the raw terrain elevations; furthermore, using separate hydraulic structures allows the weir equation to compute the overflow (if desired) and breaching of the embankments. Additionally, these separate SA/2D hydraulic connections can be used to breach the roadway embankments, if desired.
Entering the Bridge Data
To enter the bridge data, either left click on the bridge centerline and choose Edit Connection, or open the SA/2D Area Conn editor and select the correct structure. Figure 3-50 provides an example view of the first time the SA/2D Connection Data Editor is opened for a new SA/2D Area Conn.
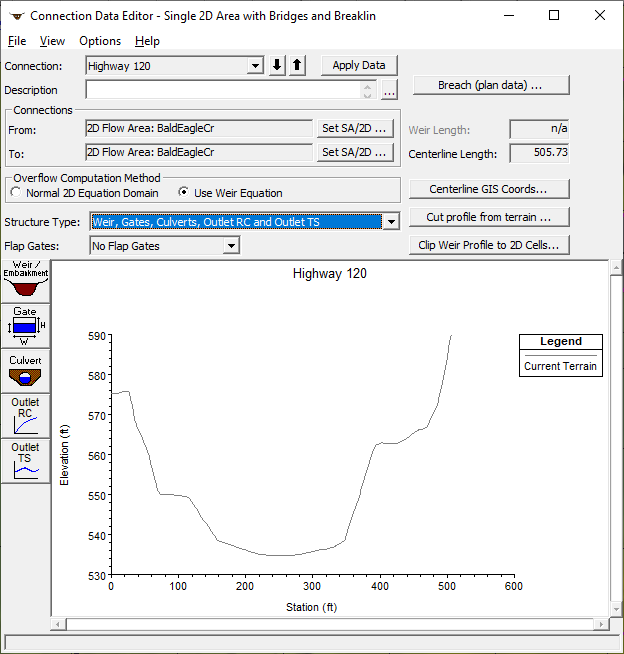
From the SA/2D Connection Data Editor (Figure 3-50), the first step is to change the Structure Type from the default selection (Weir, Gates, Culverts, Outlet RC and Outlet TS) to a Bridge (Internal to 2D Flow Area). The SA/2D Connection Data Editor updates as displayed in Figure 3-51.
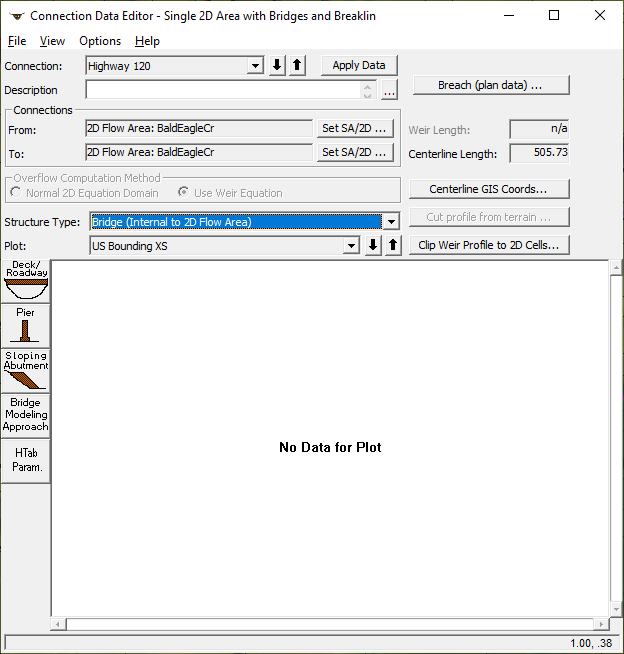
The SA/2D Connection Data Editor with the Bridge (Internal to 2D Flow Area) Structure Type selected, contains data editor icons (located left of the Plot window) for entering a Deck/Roadway, Pier, Sloping Abutment, the Bridge Modeling Approach and the HTab Param. (parameters).
The first step is to enter the Bridge Deck/Roadway data. Click the Deck/Roadway icon to open the Deck/Roadway Data Editor (Figure 3-52).
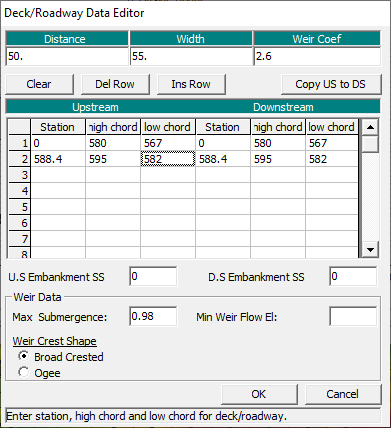
As shown in Figure 3-52, the user must enter the Distance (this is the distance from the upstream side of the bridge deck to the cross section upstream outside of the bridge; the Width of the bridge deck in the direction of flow; a Weir Coefficient for flow going over the road way; and the Station (distance from left to right along the bridge deck/roadway), High Chord, and Low Chord elevations for the upstream and downstream side of the bridge deck.
The U.S Embankment SS (upstream embankment side slope) and D.S Embankment SS (downstream embankment side slope) are optional, as the values entered are only used for plots. By default, the Weir Crest Shape is set to “Broad Crested,” which is appropriate for a bridge deck/roadway. The Max Submergence value is the submergence percentage at which HEC-RAS will stop using the weir equation and will transition to the energy balance method for developing the bridge curves under high submergence. Click OK to save the deck or roadway data and return to the Connection Data Editor.
The next step is to enter any piers or abutments that are inside of the bridge opening. From SA/2D Connection Data Editor, click the Pier icon and the Pier Data Editor opens (Figure 3-53).
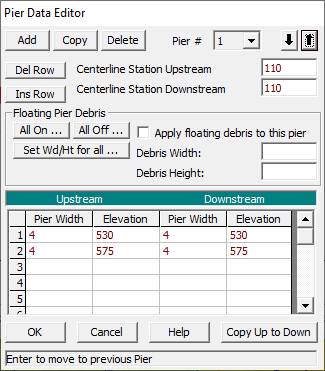
As shown in Figure 3-53, the user enters pier data in the same exact manner as required for a 1D bridge. A Centerline Station is required for both the upstream and downstream side of the bridge pier. The pier is formed by entering pairs of elevations versus pier widths, starting below ground and continuing up past the low chord of the bridge deck. The paired elevation and pier width values must be completed for both the upstream side and downstream side of the bridge. However, if the upstream and downstream sides are the same, then fill in the upstream side and use the Copy Up to Down button to copy the data to the downstream side. Click OK to add the pier and return to the Connection Data Editor.
The abutment editor (accessed from the Connection Data Editor by clicking the Sloping Abutment icon) allows users to add abutments inside of the bridge opening that are different than the natural ground. For example, “Spill through Abutments” are abutments that have a slope and often a rounded or angled approach to guide the flow through the opening. The abutment editor is the same as for 1D bridges, and works the same way. The user enters station and elevation data going from left to right, for each abutment in order to modify the terrain through the bridge opening.
After the bridge deck/roadway, piers, and any abutments are entered, the editor will show the bridge information graphically. See Figure 3-54 below.

The next step is to enter Manning’s n values for all of the 1D cross sections that are automatically formed by the user entered bridge data. To enter Manning’s n values for the 1D cross sections, go to the Options menu and select External and Internal Bridge Cross Sections. in the Bridge Cross Sections editor (Figure 3-55) opens.
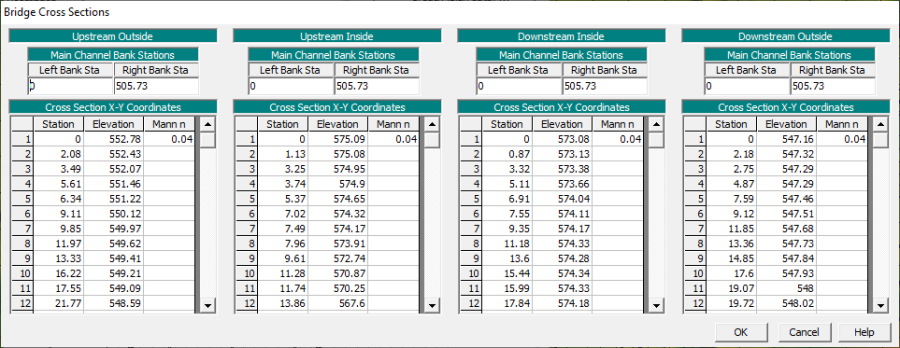
As shown in Figure 3-55, the user must enter Manning’s n values for each of the four bridge cross sections (Upstream Outside, Upstream Inside the bridge deck, Downstream Inside the bridge deck, and Downstream Outside the bridge). Manning’s n values are entered as horizontally varying values, starting with the very first station within the cross section. At least one n value must be entered for each cross section. Users can also modify the cross-section station elevation data from the Bridge Cross Sections editor. However, the length of the cross section must stay the same as what is spatially laid out form the bridge centerline data and other bridge information. The left and right main channel bank stations can also be changed; by default, they are set to the first and last point of each cross section. When the cross section data has been entered, click OK to return to the Connection Data Editor.
The next step for entering the bridge data is to define the bridge modeling approach. From the Connection Data Editor select the Bridge Modeling Approach button to open the Connection Bridge Modeling Approach Editor (Figure 3-56).
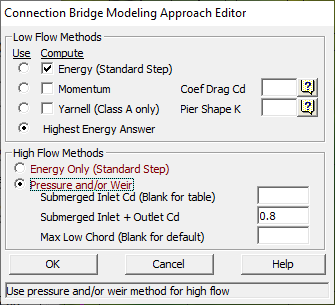
The Connection Bridge Modeling Approach Editor (Figure 3-56) is very similar to the bridge modeling approach editor for 1D bridges. The user can select one or more low flow bridge hydraulic methods (water stays below the low chord of the bridge deck and does not pressurize the bridge opening) and take the Highest Energy Answer as the selected answer. Available Low Flow Methods are: Energy, Momentum, and Yarnell. The WSPRO low flow bridge modeling method was removed, from this editor in HEC-RAS Version 6.0, as it requires approach and exit cross sections which are not available inside of a 2D flow area.
The High Flow Methods are: Energy Only and Pressure and/or Weir flow. The Pressure and/or Weir high flow method should be used when the bridge deck blocks a significant amount of the flow area, and the resulting upstream water surface will be significantly higher than the downstream water surface. This situation will cause the flow going over the roadway to pass through critical depth, much like a normal weir. In general, the Energy high flow method should be used if the bridge deck is a smaller portion of the flow area, and the resulting upstream and downstream water surface will not be significantly different. Click OK to save the selected bridge modeling approach and return to the Connection Data Editor.
The last step for entering the bridge data is to define the HTAB Parameters. From the Connection Data Editor, click the HTab Param button to open the Connection Hydraulic Property Table Parameters editor (Figure 3-57).
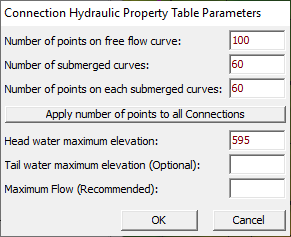
As show in Figure 3-57, the user must enter the following information: Number of points on free flow curve (maximum is 100), Number of submerged curves (maximum is 60), Number of points on each submerged curve (maximum is 60), and Head water maximum elevation. The Tail water maximum elevation is optional, as is the Maximum Flow. However, the maximum flow is recommended as it will help control the limits of the connection hydraulic property table. Click OK to close the editor and return to the Connection Data Editor.
After adding all of the necessary bridge data, close the editor by clicking the File | Exit menu command. The entered bridge data will be added to the Geometric Data window similar to the bridge shown in Figure 3-58. As displayed in Figure 3-58, the grey area is the bridge deck/roadway. The black and red dotted line is the bridge centerline. There are also four red dotted lines, which represent the four cross sections that will be extracted and used by the geometric pre-processor to perform the bridge hydraulic computations in order to develop the family of rating curves for the bridge. The user can view the four cross sections from the SA/2D Area Connection Data Editor.
For modeling bridges inside of a 2D flow area, HEC-RAS will automatically create the four needed cross sections for pre-processing the bridge hydraulics into a family of curves. These four cross section locations are:
- Upstream just outside the bridge deck, normally at the toe of the upstream embankment. This cross section is automatically generated upstream of the bridge deck based on the user entered Distance field (entered in the bridge Deck/Roadway Data Editor).
- Upstream just inside the bridge deck and/or roadway.
- Downstream just inside the bridge deck and/or roadway.
- Downstream outside of the bridge deck and/or roadway, normally at the toe of the downstream embankment. This cross section is automatically generated downstream of the bridge deck a distance equal to what the user entered for the upstream Distance field.
For the two cross sections inside the bridge, they follow the edges of the deck/roadway. However, for the outside cross sections, HEC-RAS automatically generates their locations by simply creating cross sections that are parallel to the inside cross sections. The distance upstream and downstream from the bridge deck is based on the user-entered Distance value (entered within the Deck/Roadway Data Editor). If the user changes the deck and/or roadway data entered in the Deck/Roadway Data Editor (i.e., Bridge Width or Distance), then the locations of the 1D cross sections outside the bridge and/or roadway will change. The user can view each of the four cross sections, as well as the centerline data (the centerline terrain data is applied to the 2D cell faces inside of the bridge). If the bridge data changes, the user will see that the terrain under the current 1D cross section line does not match the updated 1D cross section locations. However, to fix the out-of-date cross sections, the user can recut any of the 1D cross sections by simply pressing the Cut Profile from Terrain button (selected from the Connection Data Editor, from the Options menu) while viewing a specific cross section.
The user entered bridge deck/roadway, piers and abutments are applied to the inside 1D cross sections. However, this data is averaged (interpolated between the two inside cross sections) in order to modify the terrain data of the 2D cell faces that are at the centerline of the bridge. The bridge centerline ground is interpolated, from the two cross sections inside the bridge, at the upstream and downstream end. The bridge centerline is interpolated in this manner because the bridge curves are based on those cross sections, and the terrain at the centerline was not used to develop the bridge curves. Additionally, the user can edit the internal bridge curves, say for example to better represent the terrain inside the bridge. Therefore, interpolating the centerline from the two cross sections inside the bridge is necessary to be consistent with the cross sections used to make the bridge curves, and to maintain model stability. In other words, check that the bridge centerline profile is appropriate because that is the profile being used for the terrain data of the bridge centerline faces for the 2D cells.
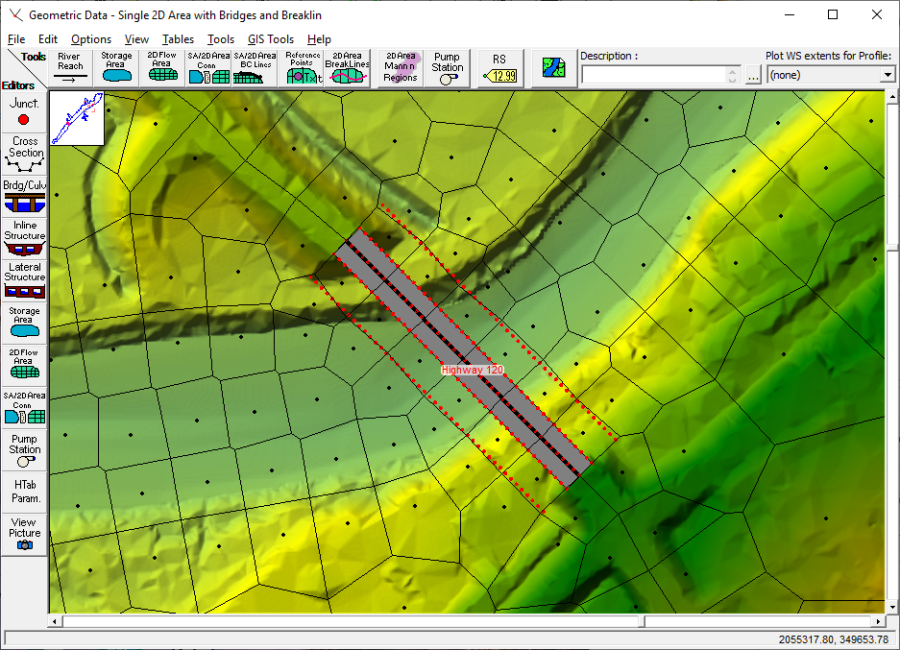
As shown in Figure 3-58, this bridge was laid out to only represent the bridge opening and abutments. The road approaches are being modelled with cell faces aligned with the high ground of the roadway. Note, the example provided in Figure 3-58 for modeling the road approaches is just one of the options available in HEC- RAS. The roadway approaches could have been included as part of the bridge, and the deck/roadway could have been used to refine the elevations of those roadway approaches. If the roadway approaches were included as part of the bridge model, then Ineffective Flow Areas would need to be entered for the two cross sections outside of the bridge. There is an option to add Ineffective Flow Areas for these cross sections under the Options menu of the SA/2D Area Conn editor.
For the bridge modeling approach shown in Figure 3-58, there are six cells going across the bridge. The SA/2D Area Conn (Bridge in this case) allows the user to define a cell spacing along the centerline, then enforce that cell spacing such that the cells start and end exactly at the beginning and end of the bridge deck/roadway (this is a requirement for all structures modelled with the SA/2D Area Conn). When forming the cells around the bridge, it is a good idea to use the mesh/cell option for “Near repeats.” The “Near repeats” option means that not only will HEC-RAS form the cells around the bridge centerline, but it will repeat those same exact cells outside of the initial cells. This option allows the cells around the bridge centerline to be square. Keep in mind, these four bridge cross sections are only used to develop the bridge curves, but the flow through and over the bridge is still being solved using the 2D flow equations.
There are several Options available for Bridges inside of 2D Flow Areas. From the Options menu at the top of the SA/2D Area Connection Data Editor, the following options are available:
- External and Internal Bridge Cross Sections – This option allows the user to edit the four cross sections that will be used for the bridge in computing the bridge curves. The user can change the station/elevation data, Manning’s n values, and the main channel bank station locations. Also, if the bridge deck/roadway data is changed, the location of the four cross sections will change. The user also has the option to re-cut the cross sections from the terrain using the button labeled “Cut Profile from Terrain”. This button will re-cut the current cross section being viewed in the editor.
- Bridge Ineffective Regions – This option allows the user to define ineffective flow areas for the upstream and downstream cross sections outside of the bridge. If the user has included the left and right roadway approaches as part of the bridge, then it may be necessary to define ineffective flow areas for the outside cross sections in order to compute accurate headwater and tailwater elevations for the bridge curves.
- Momentum Equation – This option allows the user to control which components of the low flow Momentum bridge hydraulic method are turned on or off. For more details on this review the chapter on 2D Bridge Hydraulics in the HEC-RAS Version 6.0 Hydraulic Reference Manual.
- Class B Defaults – This option allows the user to control where critical depth will be calculated/used for Class B low flow. For more details on this review the chapter on 2D Bridge Hydraulics in the HEC-RAS Version 6.0 Hydraulic Reference Manual.
- Pressure Flow Criteria – This option is used to define when the software will start checking for the flow to transition from low flow to pressure flow. By default, HEC-RAS uses the energy gradeline of the upstream outside cross section. This default method is conservative and can often lead to the software jumping to pressure flow for bridges that have high velocities. The user can change this criterion to the “water surface elevation” if the bridge hydraulics are jumping to pressure flow too soon.
Pre-Processing the 2D Bridge into Curves
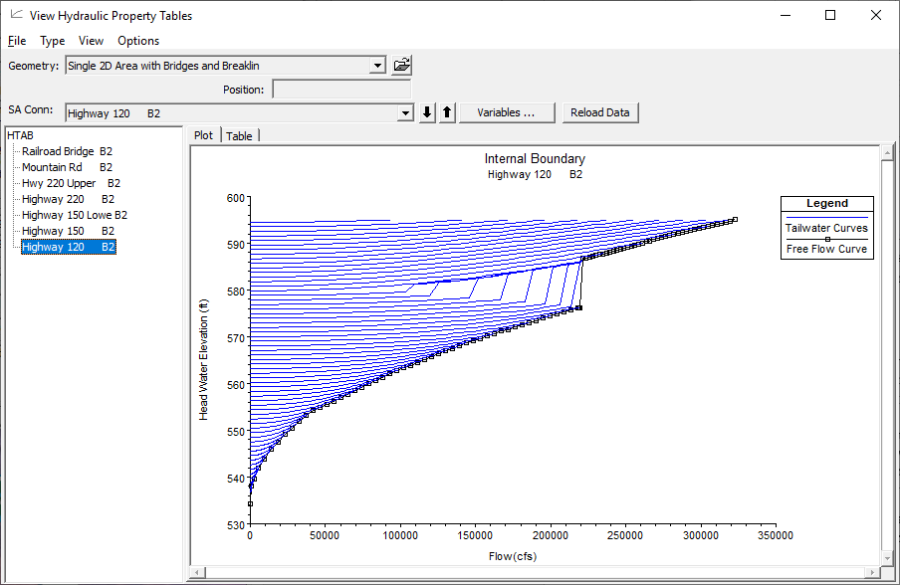
After the user has entered the bridge data and has ensured that the mess/cells and the 1D cross sections are well formed around the bridge, then the user must run the 2D Geometric Preprocessor to generate the bridge family of curves (which is computed for each bridge in the model). If HEC-RAS detects that the Geometric Preprocessor needs to be computed, then the software automatically runs the preprocessor before an unsteady flow simulation. However, the user can just run the Geometric Preprocessor, without performing the full Unsteady Flow computations, to view the bridge curves before the unsteady flow computations are performed. Either way, once the geometric preprocessor is run, the user can view the family of curves for each of the bridges in the model.
To view the bridge curves, press the Hydraulic Tables button ![]() on the main HEC-RAS window. Then from the View Hydraulic Properties Tables window, from the Type menu, select SA/2D Area Connections. Shown in Figure 3-59 are the bridge curves for the example bridge displayed in Figure 3-58.
on the main HEC-RAS window. Then from the View Hydraulic Properties Tables window, from the Type menu, select SA/2D Area Connections. Shown in Figure 3-59 are the bridge curves for the example bridge displayed in Figure 3-58.
Performing the Computations and Viewing the Results
Once the model has finished running the user can begin to view the output related to the 2D bridge hydraulics.
There are several ways to view output for 2D bridges within HEC-RAS. These viewing options include:
- Inundation maps in RAS Mapper, including water surface, velocity, etc.
- Profile line plots viewed in RAS Mapper.
- Stage and Flow Hydrograph plots opened from the HEC-RAS main window by clicking the Plot Stage and Flow Hydrographs button, or by left clicking on the structure in the Geometric Data editor and selecting “Stage and Flow Hydrograph.”
- Cross section plot of the SA/2D Area Connection. From the Cross-Section plot window, select “SA/2D Area Conn” from the Type menu.
- Tabular Output from the detailed output tables for the SA/2D Hydraulic Connection that represents the bridge.
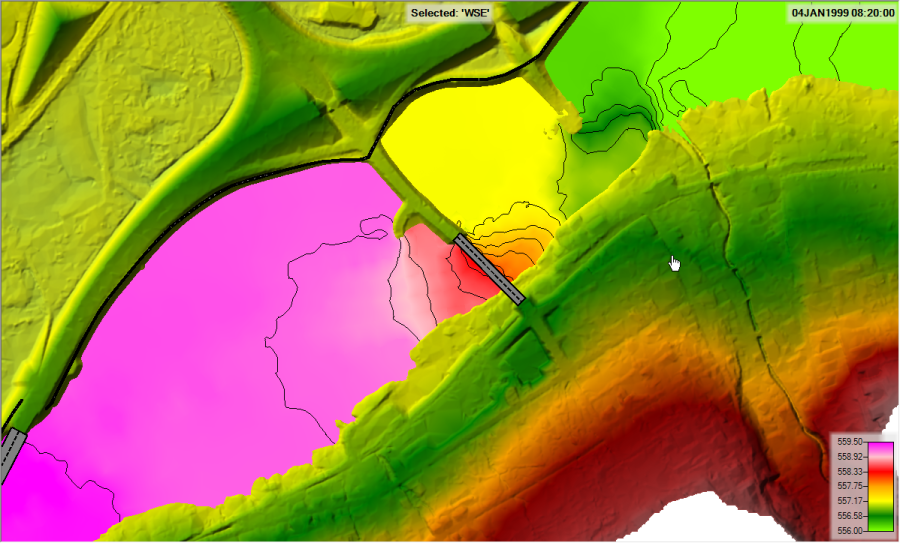
Output from RAS Mapper is available in many forms. The most common output is maps of water surface elevation and velocity. Shown in Figure 3-60 is a colored water surface elevation plot though the bridge area. For the example provided in Figure 3-60, the water surface elevation plot also has water surface contours turned on at the 0.2 ft level, which provides more context into how and where the water surface is changing.
Another very useful plot, especially in the area of the bridge, is one of colored velocity with particle tracers enabled. Shown in Figure 3-61 is a velocity plot with particle tracers enabled.
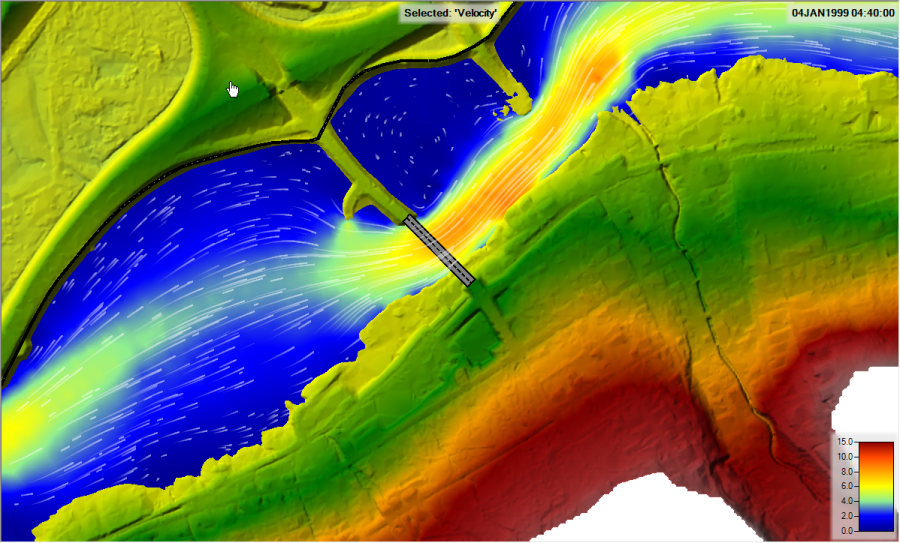
One thing to make note of from both Figures 3-60 and 3-61: the flow is computed as “true” 2D flow through the bridge, even if it overtops the bridge. The 1D cross sections and bridge information are used to compute the family of rating curves, but the curves are only used to obtain the momentum force loss through the bridge opening. This approach does not force a 1D bridge water surface or velocity. As shown in the Figures 3-60 and 3-61, the water surface varies across the channel upstream of the bridge, through the bridge, and downstream of the bridge. The velocity also varies, from cell to cell, based on the terrain, degree of constriction, and roughness coefficients.
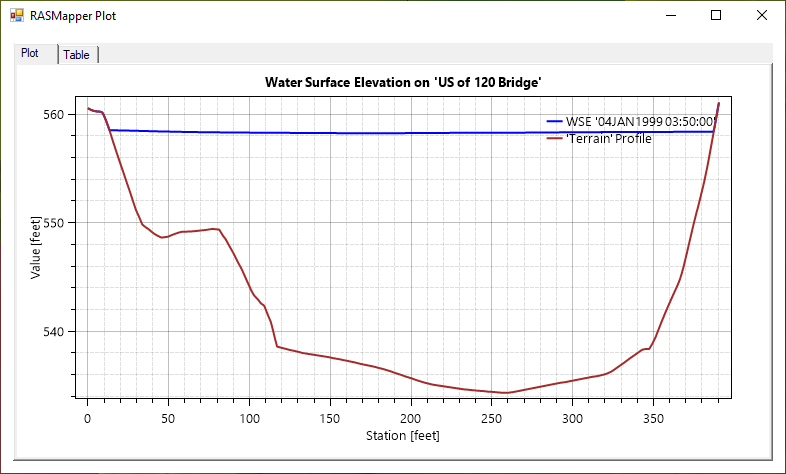
Another useful output from RAS Mapper are Profile Line Plots. A common use of profile lines is to draw a line down the centerline of the channel and then request a plot of the terrain and the computed water surface elevation. Shown in Figure 3-62 is an example of a terrain and water surface elevation plot through the area of the bridge.
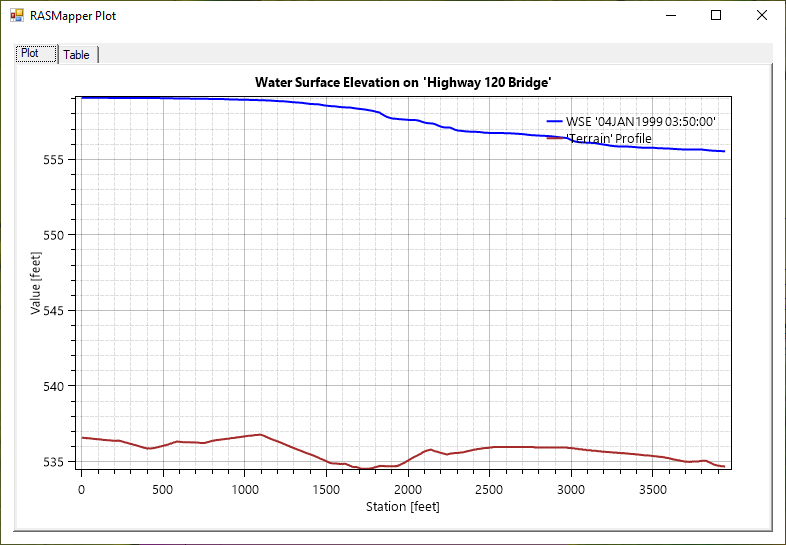
Another example of a Profile Line Plot for the bridge is displayed in Figure 3-63, and this example is a plot of a cross section view just upstream of the bridge.
