The total roughness of a mobile bed river is the sum of the grain related roughness and the bedform roughness. Since both of these can vary with flow, the total roughness will also vary with flow. HEC-RAS Version 6.6 has the ability to vary the bottom roughness (i.e. Manning's n) as a function of flow by specifying a curve of roughness factors as a function of flows. This 2D feature works similar to 1D, but instead of using the flows at cross-sections, the flows are calculated as the outflows from Calibration Region polygons.
The first step in entering Flow Roughness Factors is to create one or more Calibration Regions. This step can be done in the Geometric Data Editor or RAS Mapper. In the Geometric Data Editor, Calibration Regions are created by selecting the tool  , drawing a polygon, and then providing a name for the region. In RAS Mapper, Calibration Regions are created by editing a geometry, selecting the Calibration Regions node under the Manning's n node, drawing a polygon and providing a name.
Calibration Regions can be used to to override Manning's roughness coefficient and/or to specify Flow Roughness Factors. As mentioned above, the roughness factors are specified as a function of the Calibration Region outflows. Depending on the shape of the polygon, these flows may not be the same as the river flows. For example, the Calibration may not extend over the entire width of the river leading to a smaller flow compared to the river flow, or the polygon may include outflows which are not directed downstream which will lead to a larger outflow compared to the river flow. For this reason, it is often useful to draw the Calibration Region in such a way that these effects are minimized and the outflow is more comparable to the river flow. This can be done by extending the polygon in the transverse direction past the wet/dry boundary, thus capturing the entire river flow in the longitudinal direction and eliminating the effects from polygon outflows in the transverse direction (see example below).

If the Calibration Region polygon outflows do not correspond well to the river flows, then it is recommended to do a preliminary run without the Flow Roughness Factor factor to compute the range in outflows which can be used to estimate the flows in the Flow Roughness Factor curve.
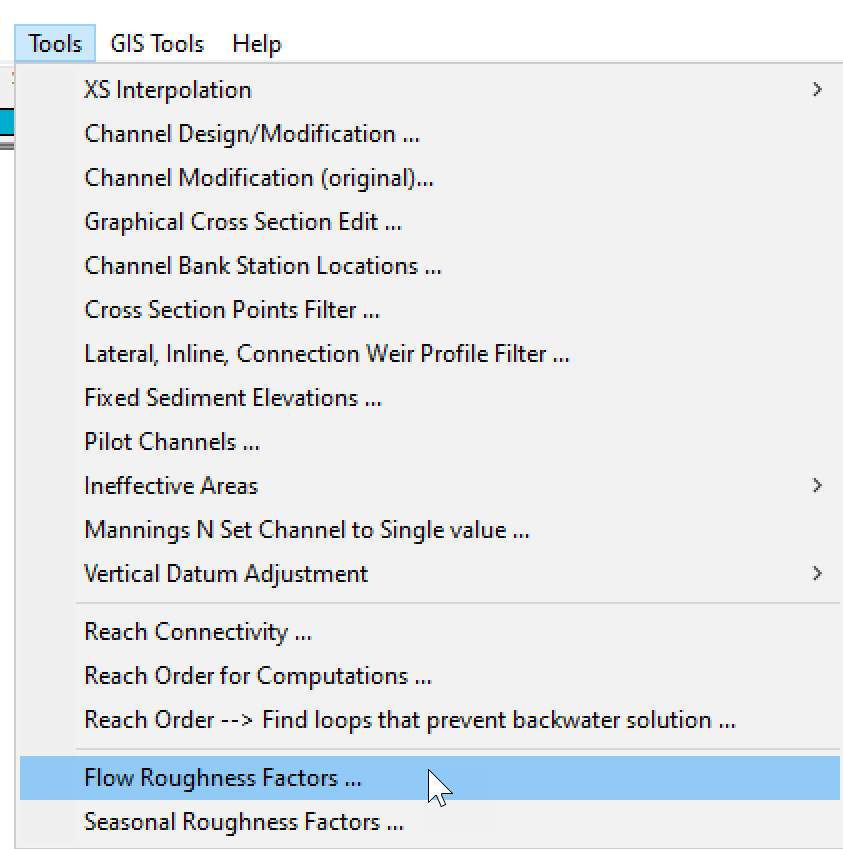
To specify a Flow Roughness Factor for a Calibration Region, open the Geometric Data Editor, and click on Tools | Flow Roughness Factors ... as shown in the image below.
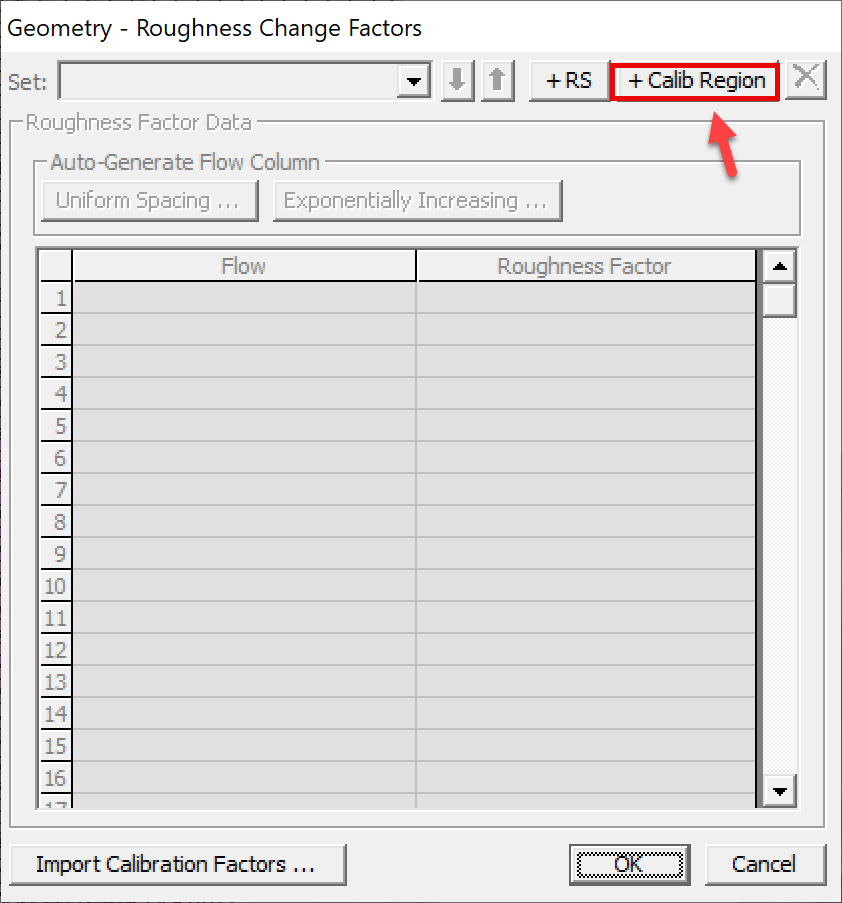
Next, click on the button labeled +Calib Region near the top right of the Geometry - Roughness Change Factors editor.
Then enter a flow-roughness factor curve for the calibration region.
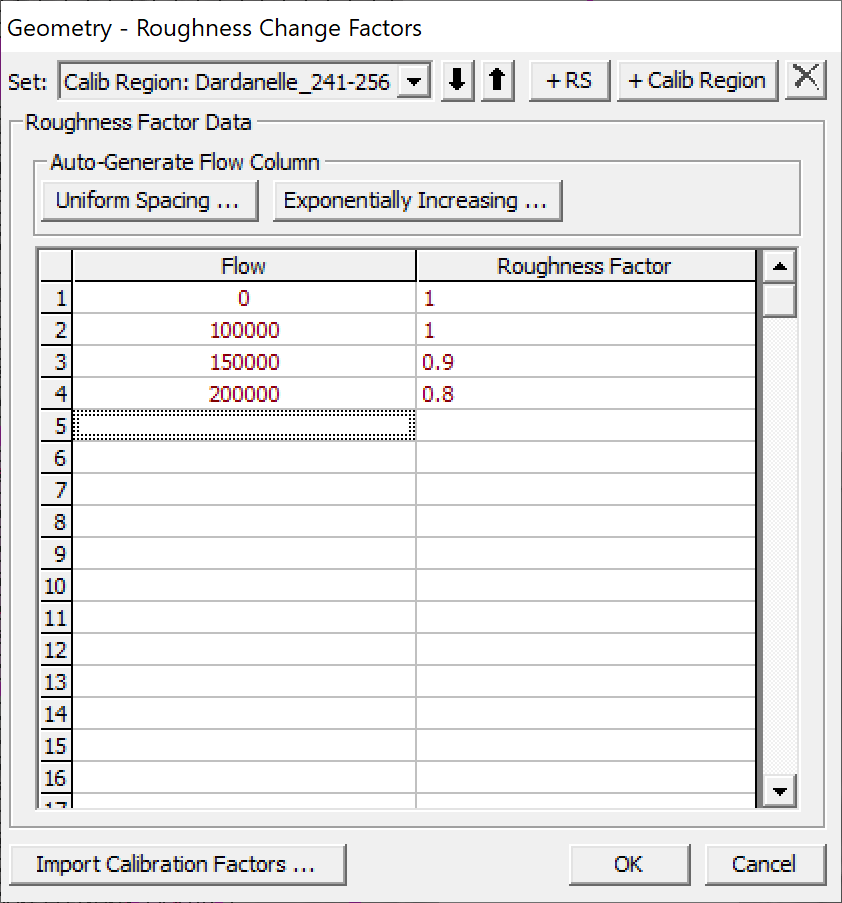
It is important to note that if the computed outflows go beyond the extends of the values in the Flow Roughness Factor curve, the roughness factors are not extrapolated.
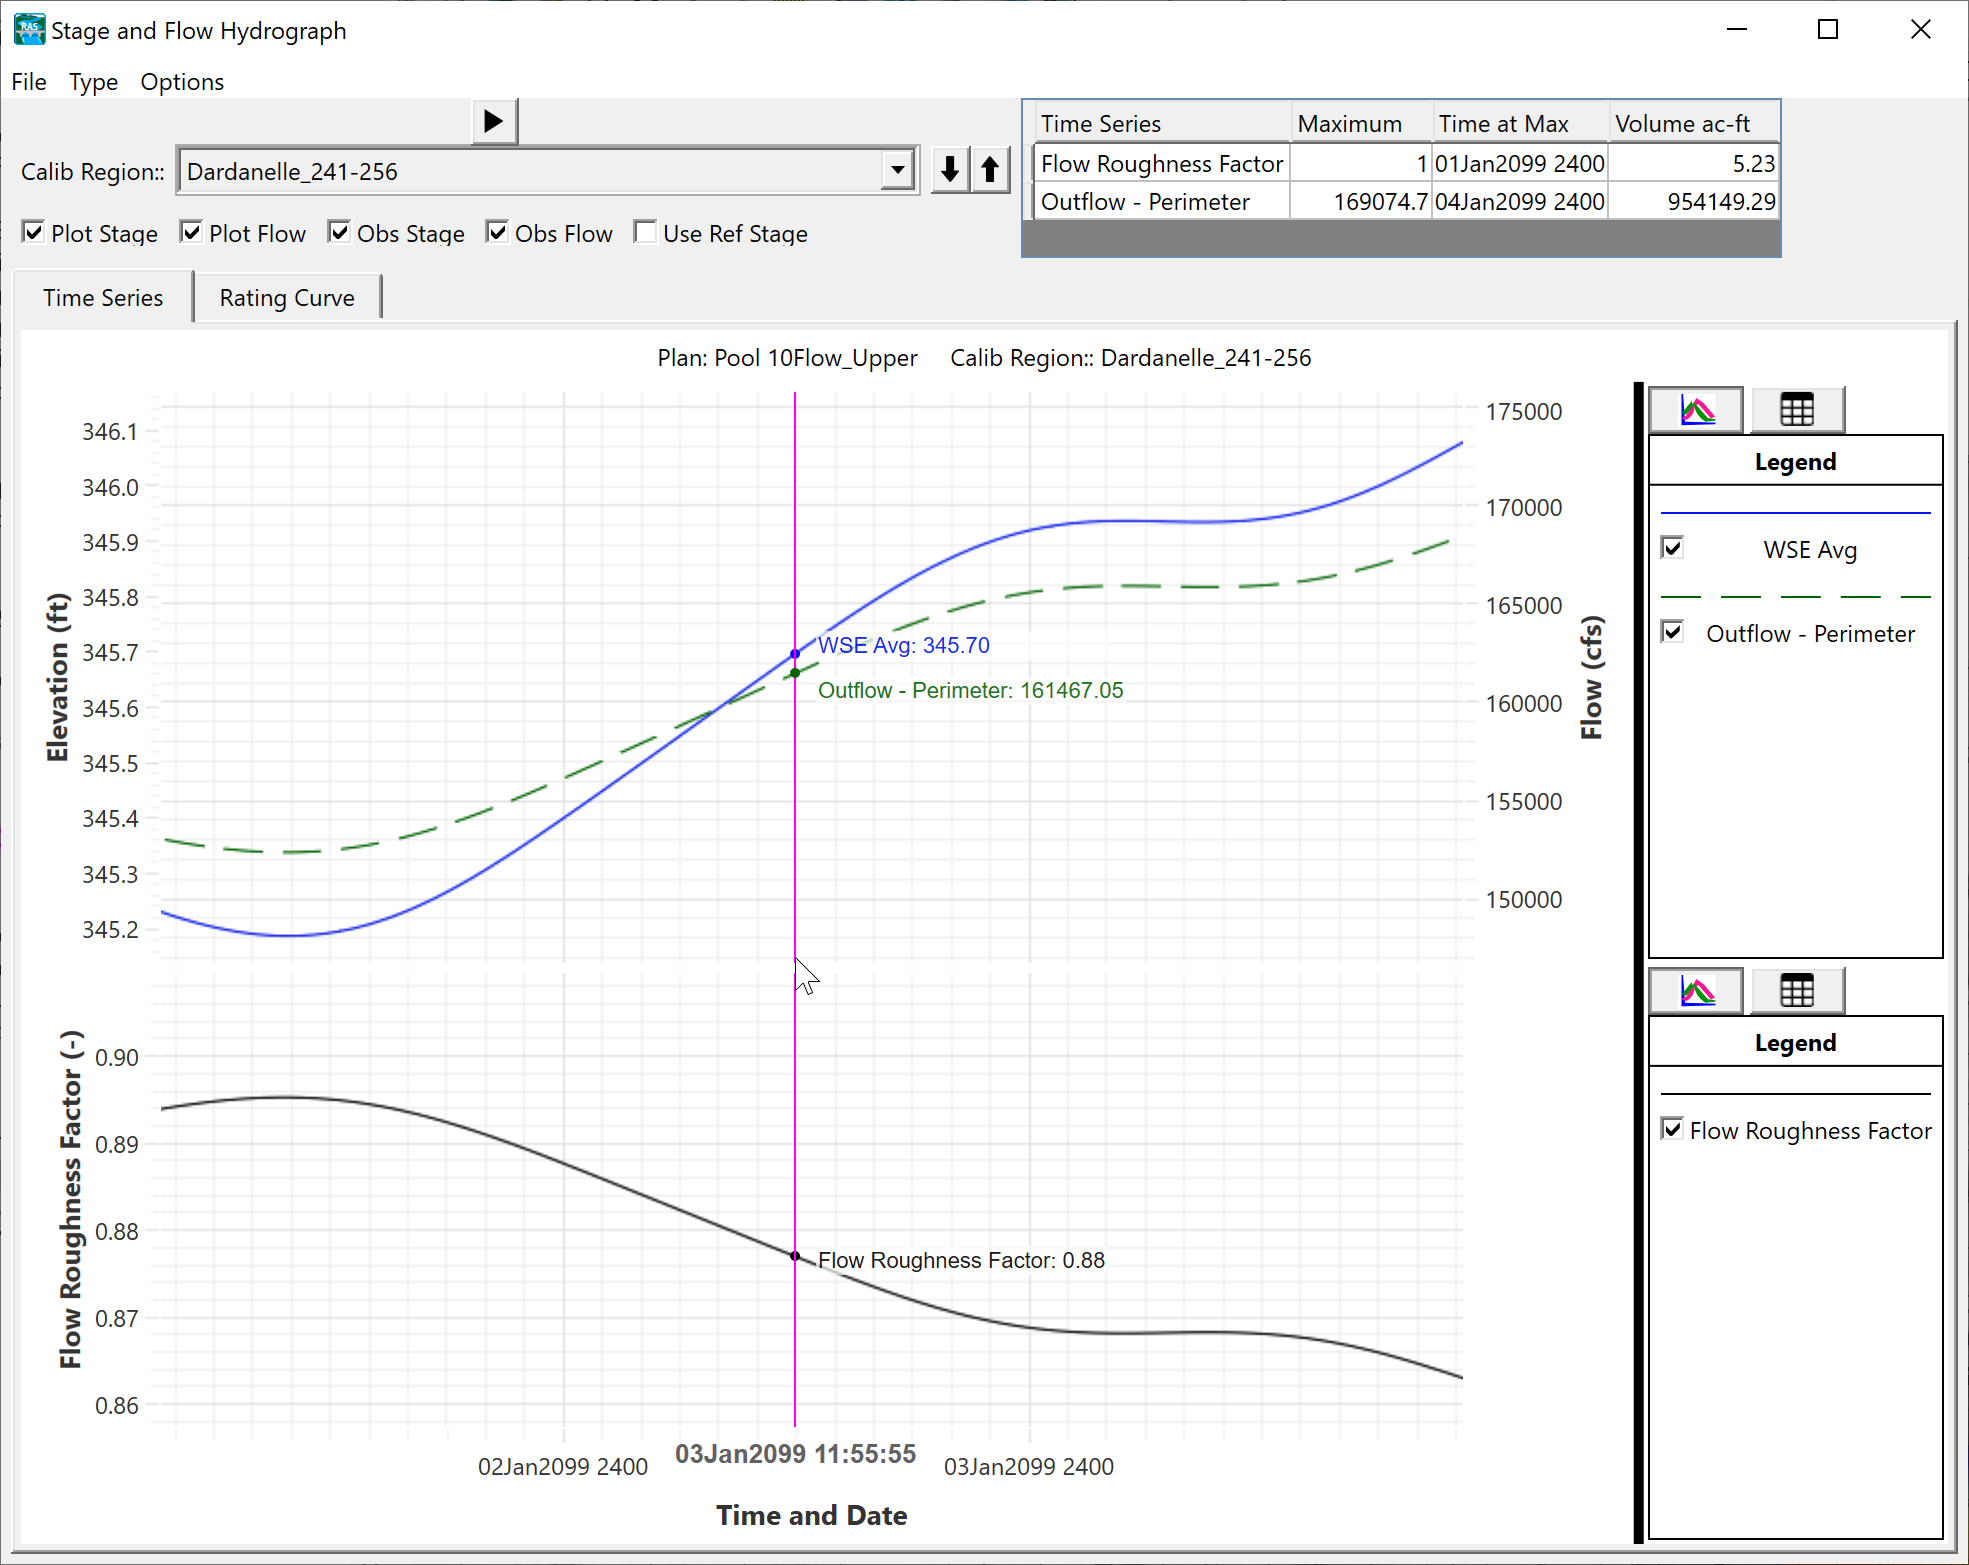
To help with model calibration, time-series of Calibration Regions outflows and flow roughness factors and other variables can be plotted in the Hydrograph Plotter. To plot Calibration Region time-series, open the Hydrograph Plotter and select the menu Type | Calibration Regions. The figure below shows an example of the Flow Roughness Factor, average water surface elevation (WSE Avg), and polygon outflow (Outflow - Perimeter).
Spatial maps and time-series can be computed by turning on the Face Manning's n dataset by going to the Unsteady Flow Analysis editor and selecting Options | Output Options ... and selecting Face Manning's n dataset from the HDF5 Write Parameters tab.
An important detail about the roughness factor is that it is not applied to any Manning's n values larger than 0.09 s/m1/3. The reasoning behind this is that large roughness values will typically represent non-mobile bed materials, such a rubble mound structures or mixed forest and therefore the bottom roughness does not vary with flow.