Download PDF
Download page Geospatial Coordinates for Hydraulic Outlets Connected to 2D Flow Areas.
Geospatial Coordinates for Hydraulic Outlets Connected to 2D Flow Areas
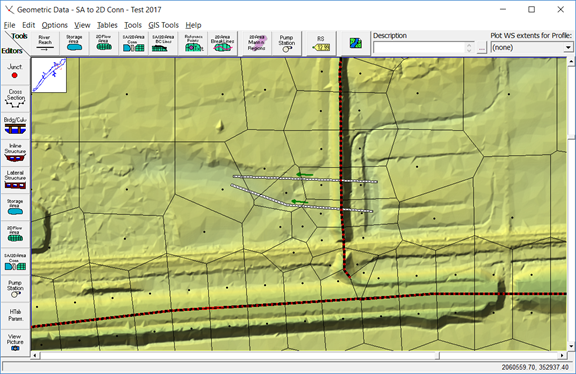
Users can enter geospatial coordinates for any of the hydraulic outlets that are connected to a 2D flow area (Lateral Structures and SA/2D Hydraulic Connections) or for hydraulic structures inside of a 2D Flow Area. The example SA/2D Area Connection displayed in Figure 3-45 shows a levee with two culverts going through the levee. Note that the culverts cross over multiple cells on the inside of the levee. This is accomplished by the fact that users can now enter X and Y coordinates for the centerlines of the culverts, as well as gates, rating curves, and flow time series outlets.
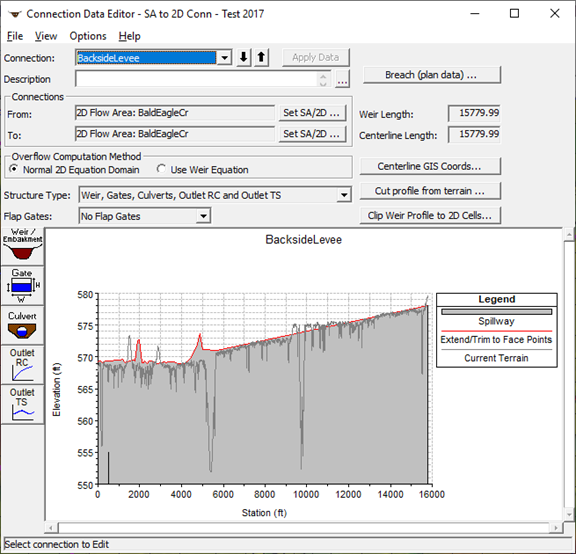
From the Geometric Data editor, click the SA/2D Area Conn button and the updated SA/2D Area Connection Data Editor will open, as shown in Figure 3 46.
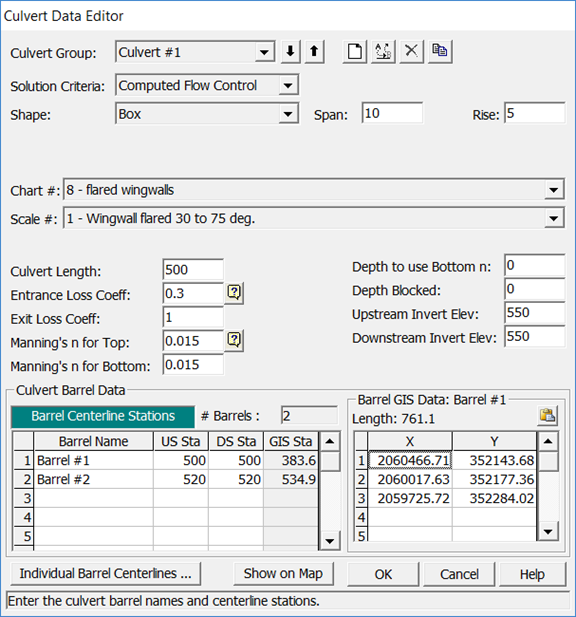
As shown in Figure 3 46, users can define several hydraulic opening types (spillways/weirs, gates, culverts, rating curves, and time series outlets) utilizing the buttons on the left side of the window and all within the same structure. The water going over the structure can be modeled with a weir equation or with the solution of the normal 2D Flow equations (Full St. Venant or Diffusion wave). Culverts can have flap gates on either side, or no flap gates. In the example shown in Figure 3-45 and Figure 3 46, there is a culvert group with two culvert barrels. If the user selects the Culvert button on the left, the Culvert Data Editor will open (Figure 3 47).
To enter spatial coordinates for a culvert, press the button on the lower left portion of the editor labeled "Individual Barrel Centerlines" (red box in Figure 3 47). This button opens the Edit GIS Data Table editor (Figure 3 48), for entering the X and Y coordinates for the centerline of each culvert barrel added to the model, which allow users to view the barrels spatially. [Note: Separate centerlines must be added even for identical barrels within the same culvert group, and the barrels may also be connected to different cells.]
Note:
The GIS centerline will be offset to represent to culvert barrel span (displayed in white). If the culvert span touches multiple 2D cells on either end the culvert it will be connected to those cells.
All Culvert centerlines (as well as gates, rating curves, and flow time series outlets), must be drawn from upstream to downstream. Keep in mind that is how the original centerline of the SA/2D Area Connection is drawn which defines upstream and downstream. Therefore, when users draw the centerline for the SA/2D Area Connection, it is drawn from left to right looking in the downstream direction. Based on that convention, when the centerlines for the hydraulic outlets (culverts, gates, rating curves, etc.) are drawn, yet again the centerlines must be drawn from the upstream side of the structure to the downstream side of the structure. For the example provided in Figure 3 46, the structure being used to model the levee was drawn from the south end of the levee to the north end of the levee. Therefore, the culverts were drawn from the right hand side of the structure (head water) to the left hand side of the structure (tailwater).
If the user presses the button labeled "Individual Barrel Centerlines" from the Culvert Data Editor, the Edit GIS Data Table centerline coordinate editor opens (Figure 3 48).
As shown in Figure 3 48, the feature centerline table contains the centerline X and Y coordinate data for all of the structures in the model. When the Edit GIS Data Table editor is opened, it will highlight the culvert that was open and selected in the Culvert Data Editor. To use this editor, from the Features table (located on the left of the editor), select a single culvert barrel (highlight it), and then past in the X and Y coordinates for the barrel into the data table (on the right hand side of the editor). Hint: The easiest way to define the culvert barrel X and Y centerline coordinates is to go back to the Geometric Data editor, hold down the Ctrl key, and digitize the culvert barrel centerline from the headwater side of the structure to the tailwater side of the structure. This digitized line can be copied to the clipboard from the Measure Line editor that pops up once digitizing the line is complete. Once all of the barrel coordinates have been entered, close all of the SA/2D Area Connection windows, and the digitized culvert(s) will appear in the Geometric Data editor window, similar to what is shown in Figure 3-45. Additionally, there is an option to import the culvert X and Y centerline coordinates at the bottom of the editor.
Note:
In HEC-RAS, the process for adding centerline X and Y coordinates for individual hydraulic outlets (gates, rating curves and flow time series, etc.) is exactly the same as described above for culverts.