Download PDF
Download page Channel Modification - Example 16.
Channel Modification - Example 16
This example demonstrates the use of HEC-RAS to perform a channel modification on an existing channel geometry using a series of trapezoidal cuts. Water surface profiles resulting from a channel modification can be compared to water surface profiles resulting from the existing channel geometry.
The user is referred to Chapter 12 of the User's Manual for discussion on modifying the existing geometric data, implementing the new channel geometry, and comparing existing and modified conditions.
To review the data files for this example, from the main HEC-RAS window, select File and then Open Project. Go to the directory in which you have installed the HEC-RAS example data sets. From the "Applications Guide\Chapter 16 – Channel Modification" subdirectory, select the project labeled "Channel Modification - Example 16." This will open the project and activate the following files:
Plan: "Existing Conditions"
Geometry: "Base Geometry Data"
Flow: "100 Year Profile"
 Example 16 - Channel Modification.zip
Geometric Data
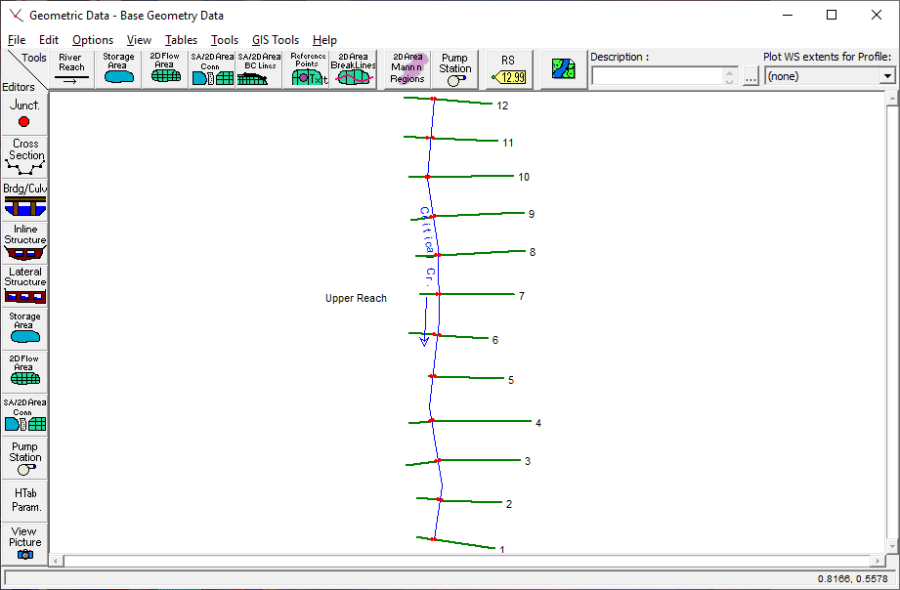
To view the geometric data for the river system, from the main program window select Edit and then Geometric Data. This will activate the Geometric Data Editor and display the river system schematic as shown in the figure below.
Channel Modification Data
To perform a modification on the channel, select Channel Modification (Original One) from the Tools menu of the Geometric Data Editor. This will activate the window shown in the figure following the figure below. The data displayed in the figure mentioned is not present upon entering a new channel modification window. The data shown in the left hand column of figure is used to construct the cuts for each cross section.
The channel modification began with the River set to "Critical Creek" and the Reach set to "Upper Reach." The Starting River Station was set by default to 12 and the Ending River Station was changed to a value of 1, the downstream end of this particular reach. The Project cut from upper RS at slope option was entered as 0.01. This option projects a cut using the specified slope from the invert elevation of the Starting River Station.
Once the correct river stations were set, the first cut was established. The Center Cuts (y/n) column in the Set Range of Values table was entered as "y." This set the centerline for the first cut at the centerline of the main channel. Next, "100" was entered in the Bottom Width column to set the width of the first cut to 100 feet along the centerline. The Invert Elevation column was left blank for the first cut, which defaults the program to the existing invert elevation of the Starting River Station. Both side slopes for the banks were entered as 2 (2 horizontal to 1 vertical). The Cut n/K column for the new Manning's n-value was entered as 0.025.
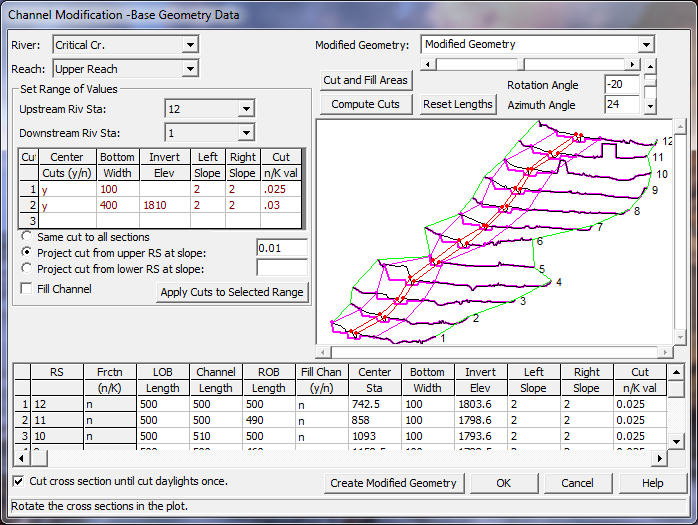
The second cut was also done on the existing centerline of the main channel. A Bottom Width of 400 feet and an Invert Elevation of 1810 feet were entered. The entry initiated the second cut at an elevation of 1810 feet, at the Starting River Station. The cut will then project with the specified slope from this elevation. The slopes were again entered with a value of 2 and Manning's n-value was entered as 0.03. After the data was entered, the Apply Cuts to Selected Range button was pressed to compute the data shown in the lower table of the figure above.
An option available to the user is Cut cross section until cut daylights. For this particular example this option was selected. As the program performs the cutting of the trapezoidal channel, the left and right banks of the channel will initiate at the invert elevation and cut through the ground until they reach open air, then the cutting will stop. If this option is turned off, the left and right banks of the trapezoid will be projected to infinity, continually cutting any ground that lies above them.
Performing the Channel Modifications
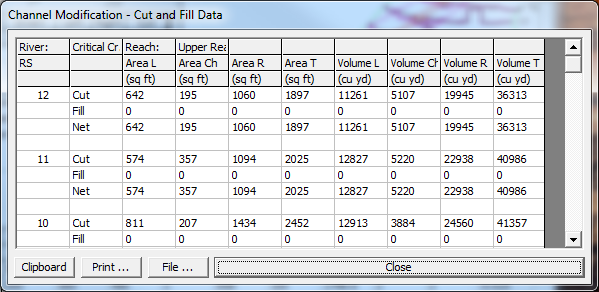
After the Apply Cuts to Selected Range was selected, the Compute Cuts button was pressed. This applied all of the channel modification data from the lower table to the graphic, updating the information. Additionally, the Cut and Fill Areas button was pressed to display the figure below.
The Cut and Fill Data displays the area and volume of each individual cut for the left overbank, main channel, and right overbank. The table also displays the total area and volume for each individual cut as well as the total volume for the entire reach.
Saving the Channel Modifications
After the completion of all channel modifications a new geometry file was created. From the Channel Modifications Data Window, represented as the second figure on this page, the title "Modified Geometry" was entered in the upper right hand window. Next, the button Create Modified Geometry was pressed and the file was saved. Finally, the original geometry file was saved to the hard disk by selecting Save Geometry Data from the Geometric Data Editor. This step was needed because the data entered in the Channel Modification Data Window is saved in the base geometry file and not the modified geometry file. Hence, when the modified geometry file was saved, the modifications which were used to create that file had not yet been saved.
Steady Flow Analysis
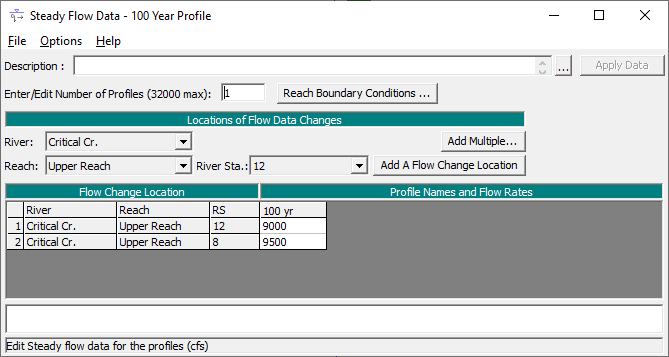
After saving all the geometric data, the steady flow data file was created. From the main program window, Edit and then Steady Flow Data were selected. This activated the Steady Flow Data Window shown in the figure below. Profiles were selected with flows of 9000 cfs at river station 12 and 9500 cfs at river station 8. The upstream and downstream boundary conditions were established as "Normal Depth = 0.01." This steady flow data file is identical to the file produced in Example 1. The user is referred to Example 1 for a further discussion on developing a steady flow data file.
Comparing Existing and Modified Conditions
Plans for the different geometry files must be manufactured before a comparison can be analyzed. Once the plans are created the user can view the graphical and tabular results.
Steady Flow Analysis
A new plan was created by selecting Run and then Steady Flow Analysis from the main program window. This activated the Steady Flow Analysis Window shown in the figure below. The Geometry File was selected as "Base Geometry Data" and the Steady Flow File was selected as "100 Year Profile." Next, a new plan was created by selecting New Plan from the File menu. The title was entered as "Existing Conditions," and the Short I.D. was entered as "Exist Cond." A mixed Flow Regime was selected and the file was saved by choosing File and then Save Plan. Finally, the Compute button was selected to perform the steady flow analysis.
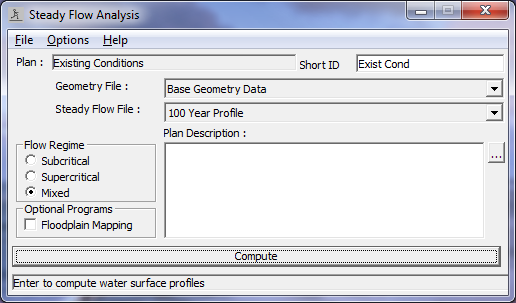
This procedure was repeated for the modified channel geometry. On the Steady Flow Analysis Window the Geometry File was selected as "Modified Geometry" and the Steady Flow File remained "100 Year Profile." The Flow Regime was changed to "Supercritical." The title was entered as "Modified Conditions Run" and the Short I.D. was entered as "Modified." The file was saved and then the Compute button was selected.
Water Surface Profiles
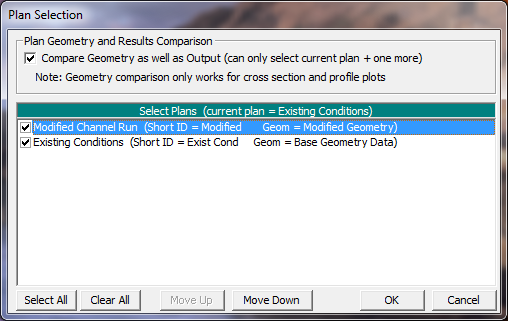
After the simulation was completed, Water Surface Profiles was selected from the View menu on the main program window. To compare the different profiles for the existing and modified channel geometry, Options and then Plans was selected from the profile plot. This displayed the Plan Selection Window. From this window the check box Compare Geometry as well as Output was selected and the existing and modified geometry plans were selected for comparison, as shown on the following figure:
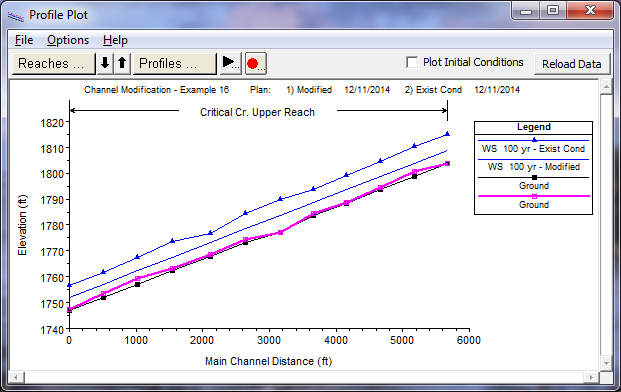
After pressing the OK button on the Plan Selection Window, the figure below was displayed. The figure shows the two plans for the existing channel geometry and the modified channel geometry. It can be seen from the profile that the existing channel geometry had a flow that was mixed between the subcritical and supercritical regime. The modified channel geometry altered the flow to be exclusively supercritical for this reach.
Cross Section Plots
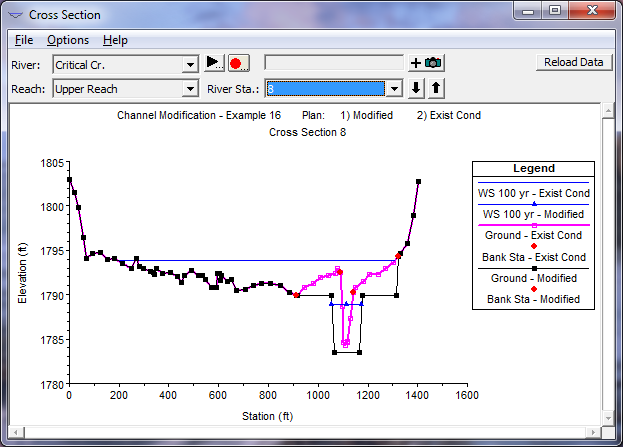
From the main program window, select View and then Cross Section. The same method illustrated in the previous section was used for selecting the existing and modified plans. The cross section plot illustrated in the figure below displays the existing and modified channel geometry along with the water surface profiles for both plans. As seen from the figure, the channel modification lowered the water surface for the 100-year event. For the modified geometry the water surface level was lowered enough to contain the 100-year flow in the main channel. In addition, the channel modifications changed the type of flow from subcritical to supercritical at this particular cross section.
X-Y-Z Perspective Plot
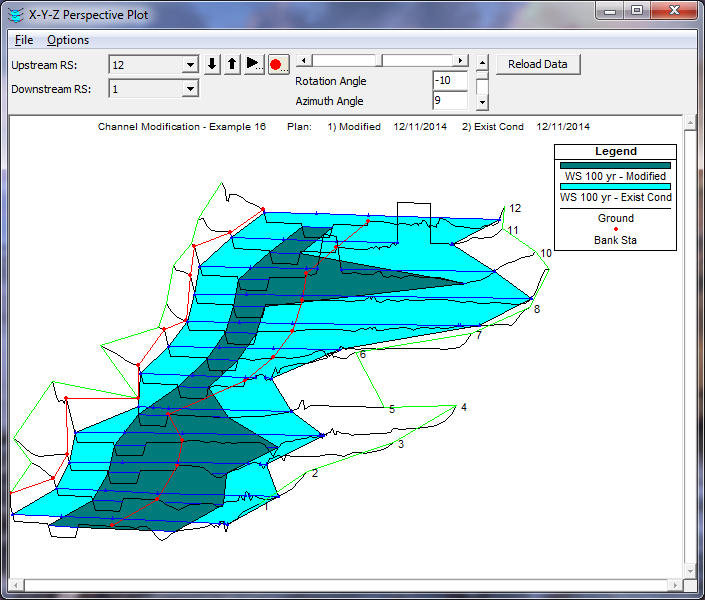
From the main program menu select View and the X-Y-Z Perspective Plots. The figure below displays the 3D plot from river station 12 to river station 1. The user can select various azimuth and rotation angles to obtain differing views of the reach. The figure shows the difference in lateral distribution of the water surfaces for the existing and modified channel geometry for the given flow data.
Standard Table
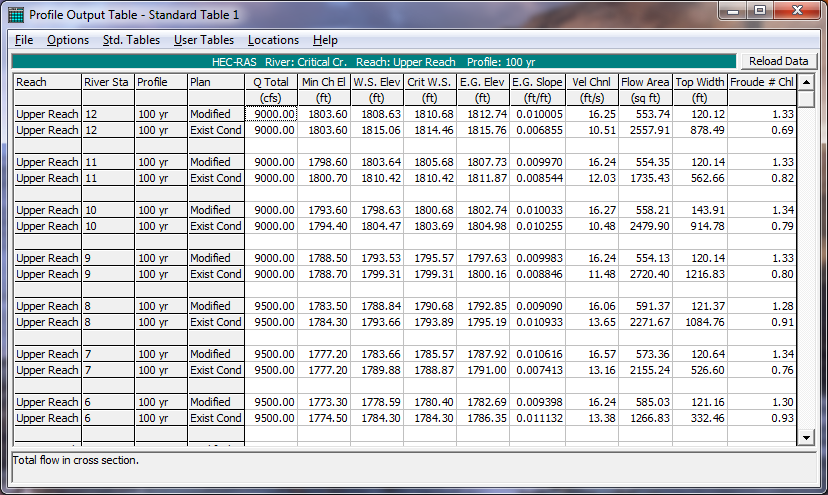
In addition to graphical display, the user can compare the output in tabular form. From the main program window, select View and then Profile Summary Table. By selecting Standard Table 1, the table shown in the figure below is displayed. The first two columns of the table display the river reach and river station. The third column identifies which plan corresponds to the data. The identifiers in this column are obtained from the Short ID entered in the Steady Flow Data Editor. The remaining portion of the table displays information about total flow, energy grade line elevation, water surface elevation, etc.
As shown in the table the modifications lowered the water surface by approximately 5 feet. The table also shows the transformation of flow from the subcritical regime, for the existing conditions, to a supercritical regime for the modified conditions. This corresponds with the increase in velocity.
Summary
The geometry of Example 1 was modified to prevent the flow from the 100- year event from overflowing the channel. This was accomplished by modifying the existing channel conditions to include two cuts down the centerline of the channel. By reviewing the water surface profiles and tables, the user can determine the benefits of a specific channel modification for a given flow.