Download PDF
Download page Groundwater Interflow - Example 22.
Groundwater Interflow - Example 22
This example focuses on the groundwater interflow boundary condition and how it can be applied within an unsteady hydraulic model. The HEC-RAS program employs Darcy's equation to represent the interplay between the surface water levels and groundwater flow. This method is merely a simplified approximation of the complex interactions between surface water and groundwater; however, for many models the level of accuracy provided by this feature is sufficient.
To activate the data files for this project, from the main HEC-RAS window, select File and then Open Project. Go to the directory in which you have installed the HEC-RAS example data sets. From the "Applications Guide\Example 22 – Groundwater Interflow" subdirectory, select the project labeled "Groundwater Interact Test" This will open the project and activate the following files:
Plan: "Groundwater Interaction Run"
Geometry:"Groundwater Geometry"
Flow: "GW Unsteady Flow"
 Example 22 - Groundwater Interflow.zip
Geometric Data
To perform the analysis, the geometric data was entered first. This data consists of the river system schematic, the cross section geometry, storage areas, and lateral structures. Each of these geometric data components are briefly described in the following sections.
River System Schematic
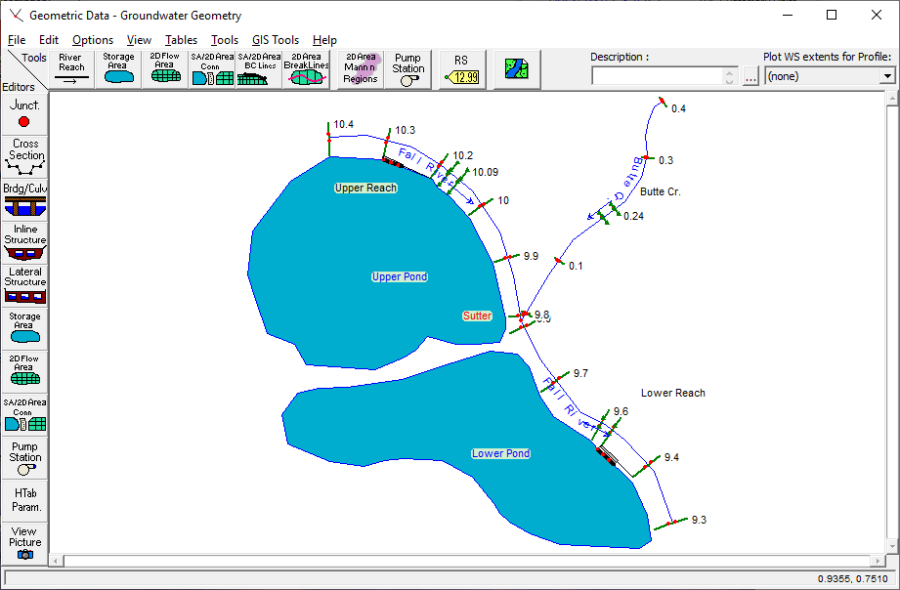
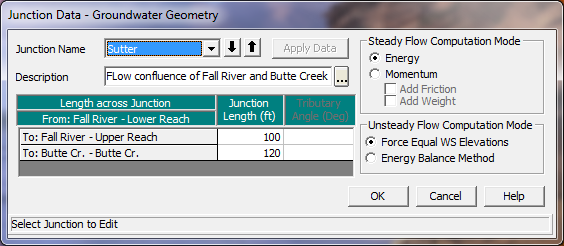
From the main program window, select Edit and then Geometric Data. This will display the river system schematic as shown in in the figure below. The river schematic consists of two rivers – Butte Creek and Fall River – that converge at Sutter Junction. The junction data was entered in the Junction Data Editor (which was selected from the Geometric Data Editor). There are a total of 20 cross sections entered along the three river reaches. In addition, there are also two storage areas that are connected to the Upper or Lower Reach of the Fall River by a lateral structure.
Cross Section Geometry
The cross section geometry consists of the cross section X-Y coordinates, reach lengths, Manning's n values, main channel bank stations, contraction and expansion coefficients, etc. The user can view this data for each river station by selecting the Cross Section icon on the left side of the Geometric Data Editor.
Creating Storage Areas
On the Tools toolbar in the Geometric Data Editor the icon for Storage Area was selected. The pointer was then placed west of Fall River Upper Reach and the storage area was drawn by single clicking and dragging the mouse for each desired point for the storage area. The final point for the storage area was selected by double clicking the mouse. Upon double clicking the mouse, a dialog box appears requesting a storage area name. The name "Upper Pond" was entered. Points on a storage area may be added or removed by using the Add Points to a Reach or SA and Remove Points to a Reach or SA options found in the Edit menu. Lower Pond was created in a similar manner. The hydraulic connections for each storage area are discussed in subsequent sections.
Entering Data for a Storage Area
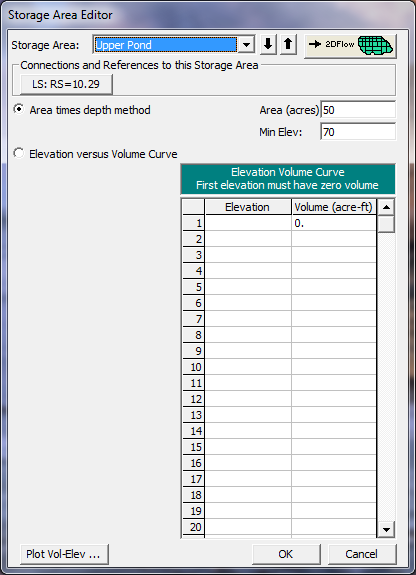
After the storage area was drawn in the Geometric Data Editor the surface area for storage was entered. The data was entered in the Storage Area Editor, displayed in the figure below, found by selecting the Storage Area icon on the Editors toolbar. Upper Pond and Lower Pond both used the Area times depth method. An area of 50 acres with a minimum elevation of 70 feet was entered for Upper Pond, while an area of 60 acres with a minimum elevation of 68 feet was entered for Lower Pond. This method computes the product of a constant area and change in water surface elevation to calculate storage volume.
Lateral Structure Connected to a Storage Area
A lateral structure was placed on the Upper Reach and Lower Reach portions of Fall River by selecting the Lateral Structure icon from the Editors toolbar in the Geometric Data Editor. After selecting the icon, the Lateral Structure Data Editor appears, as shown in the figure below. The lateral weir for the Upper Reach was added first and then the Lower Reach's lateral structure was added in a similar manner. With the River and Reach dropdowns selected as "Fall River" and "Upper Reach", respectively, under the Options menu, Add a Lateral Structure was selected. The location of the structure was entered at 10.29. This placed the beginning of the structure between river stations 10.3 and 10.2.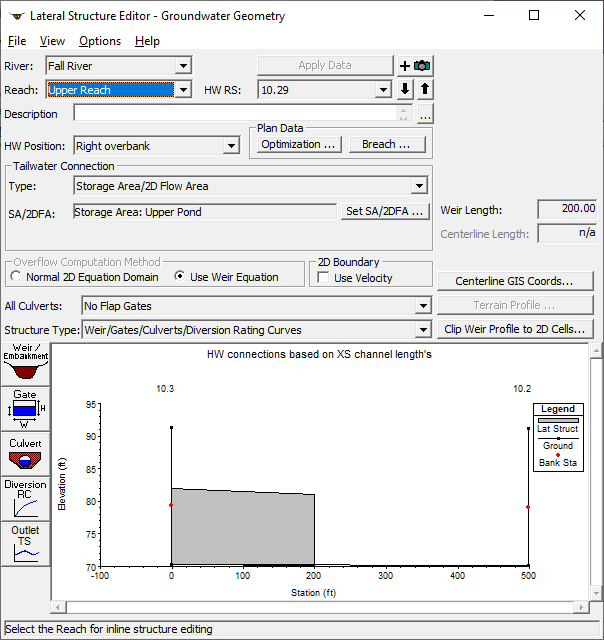
To enter data for the structure, the Weir/Embankment icon was selected from the Lateral Structure Data Editor. The data was entered as shown in the figure below on the Lateral Weir Embankment Window. The weir is broad crested with a width of 20 feet, placed one foot from the upstream river station 10.3. The weir flow reference method was chosen as "water surface."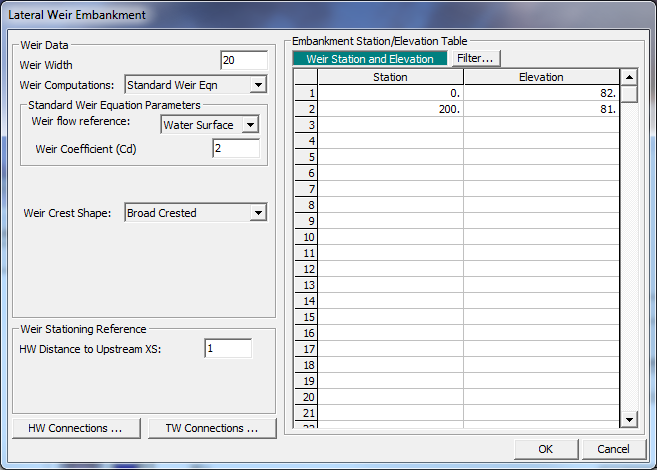
Returning to the Lateral Structure Data Editor, the "Right overbank" was selected from the pull-down HW Position menu. Lastly, a connection was made to the storage area by selecting the Set SA button. A window then popped up, allowing the user to select a storage area to connect to. On the pull-down menu "Upper Pond" was selected.
Unsteady Flow Data
The user is required to enter boundary conditions and initial conditions for the system at the beginning of the simulation period. For additional information on unsteady flow data refer to Chapter 8 of the User's Manual, Performing an Unsteady Flow Analysis. The Unsteady Flow Data Editor, shown in the figure below, was selected from the main program window under the Edit menu. 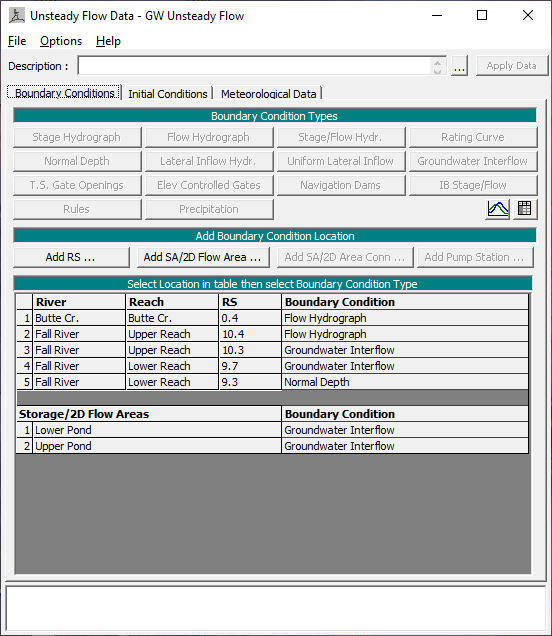
Boundary Conditions
Boundary conditions are required for the furthest upstream and downstream cross sections. Upon entering the Unsteady Flow Data Editor the furthest upstream and downstream cross sections will be located in the boundary conditions column. In this case, the user will see River Station 10.4 on Upper Reach and River Station 0.4 on Butte Creek as the upstream boundary conditions and River Station 9.3 of Lower Reach as the downstream boundary condition. Boundary conditions are set by highlighting the adjacent cell under Boundary Condition Type. When a cell is highlighted, not all boundary conditions are available. The program will automatically gray out all irrelevant boundary condition types. Internal boundary conditions may be added by selecting one of the buttons under the "Add Boundary Condition Location" heading.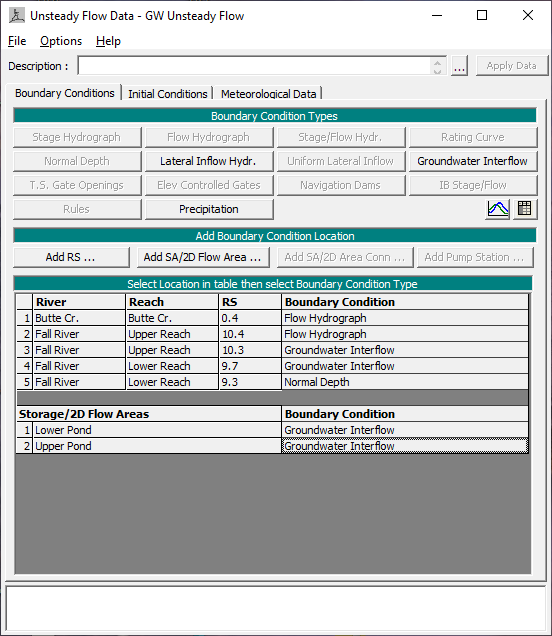
Upstream Boundary Condition
An upstream boundary condition was required at River Stations 10.4 of Upper Reach and 0.4 of Butte Creek. For River Station 10.4 of Upper Reach a flow hydrograph was selected as the boundary condition by highlighting the cell and pressing the Flow Hydrograph button. The window for entering a Flow Hydrograph then appeared (see the figure below). For this example the flow hydrograph was manually entered by selecting the Enter Table radio button. The Data Time Interval was set to one hour and the radio button Use Simulation Time was selected. The Use Simulation Time option starts the hydrograph at the beginning of the simulation time window, which is discussed in an upcoming section. The hydrograph was then manually entered with a baseflow around 500 cfs and a floodwave that peaked at 3500 cfs. A flow hydrograph was entered at River Station 0.4 of Butte Creek in the same manner.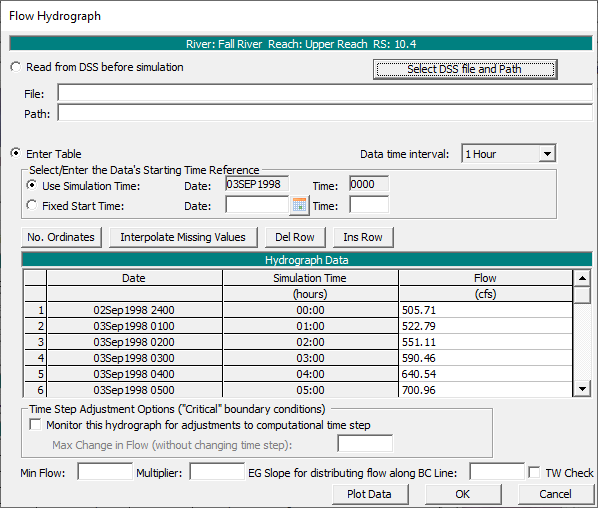
Downstream Boundary Condition
For River Station 9.3 of Lower Reach the boundary condition selected was normal depth. Again, the corresponding cell for that particular river station was highlighted and the Normal Depth button was selected. The window shown in the figure below was then displayed and a value of 0.0004 was entered as the friction slope. The slope of the water surface is often a good estimate of the friction slope.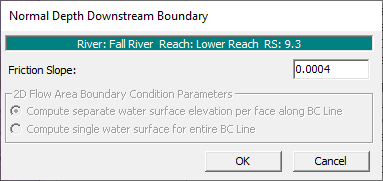
Groundwater Interflow (Internal Boundary Condition)
In this example the groundwater interflow boundary condition is applied to a section of the Upper Reach (RS 10.3 to 9.9) and Lower Reach (RS 9.7 to 9.4), as well as both storage areas. The groundwater interflow feature uses Darcy's equation to model the flow of groundwater into, or out of, a reach or a storage area, depending on the water surface head.
To enter a new boundary condition for the reaches, Add RS from the Unsteady Flow Data window was selected and then the desired river station location was selected. Once the desired river station was selected and appeared in the Selected Locations box, the OK button was clicked. This was done for both RS 10.3 and RS 9.7 and the selected RS locations were populated in the Boundary Conditions Table. The corresponding cell next to the river station number was highlighted under the Boundary Condition column and the Groundwater Interflow button was selected.
Upon selecting Groundwater Interflow as the boundary condition a window opens up titled "Groundwater Interflow" (see image below). At the top of the window, the user selects the river stations that the interflow will be between. The upstream river station is the one picked from the Unsteady Flow Data Editor earlier, while the downstream value is selected from a dropdown menu. For this example, the river stations corresponding to RS 10.3 and RS 9.7 were RS 9.9 and RS 9.4, respectively. Next, the radio button Enter Table was selected. The Data time interval dropdown was kept at the default of 1 Hour. Under Select/Enter the Data's Starting Time Reference the Use Simulation Time radio button was selected, automatically filling in the Date and Time fields. The groundwater stage was then entered for each time step.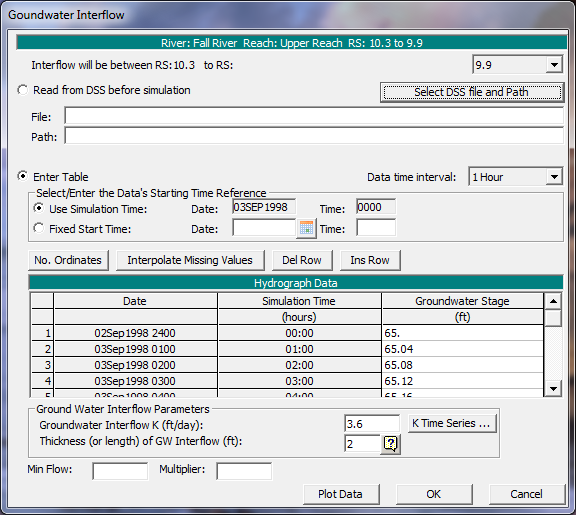
Darcy's equation requires a hydraulic conductivity (K) value, area, and a hydraulic gradient. The equation's area component is derived from the storage area or the reach's cross sectional geometry that it is referencing, while the other values are entered in the Groundwater Interflow Editor. In this example, a hydraulic conductivity of 3.6 ft/day was entered at the bottom of the window in the field Groundwater Interflow K for RS 10.3 to RS 9.9 and RS 9.7 to RS 9.4. Directly beneath this entry the Thickness (or length) of GW Interflow was entered as two feet for both river stations. The difference between the groundwater stage and the surface water stage at each time step is calculated and then divided by this value in order to determine the hydraulic gradient for each time step. Once all this data was entered, Darcy's equation had all the parameters it needed to determine if the groundwater was flowing into, out of, or was balanced with the surface water at each time step.
The same steps as outlined above were taken when adding the Groundwater Interflow boundary condition for the two storage areas with the exception that the button Add Storage Area was chosen as opposed to "Add RS" and the values entered were different. Once all the data was entered, the window was closed and the data was stored by clicking OK.
Initial Conditions
Initial conditions consist of flow and stage information at each of the cross sections, as well as elevations for any storage areas defined in the system. Data for initial conditions are established by selecting the Initial Conditions tab on the Unsteady Flow Data Editor.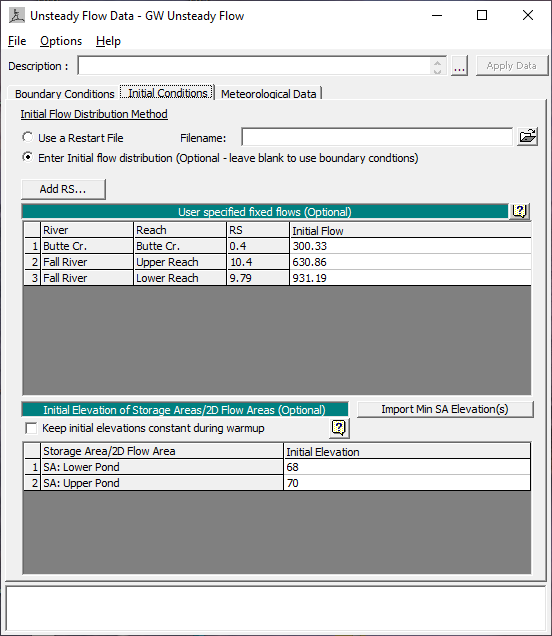
Flow data was entered for each reach so the program could perform a steady-flow backwater run to compute the corresponding stages at each cross section. As shown in the figure above, the Upper Reach has an initial flow of 630.86 cfs and Butte Creek has an initial flow of 300.33 cfs. These two reaches converge at Fall River RS 9.79 and the resulting initial flow entered at this location is the summation of Upper Reach and Butte Creek initial flows (300.33 cfs + 630.86 cfs = 931.19 cfs). In addition to flow data, the initial water surface elevation for each storage area is needed. Initial elevations were set to 68 and 70 feet for Lower Pond and Upper Pond, respectively. Since the bottoms of the storage areas were set to these same values in the Geometric Editor, this implies that the storage areas are dry at the beginning of the simulation. The data was then saved in the Unsteady Flow Data Editor and the window was closed.
Unsteady Flow Data Analysis
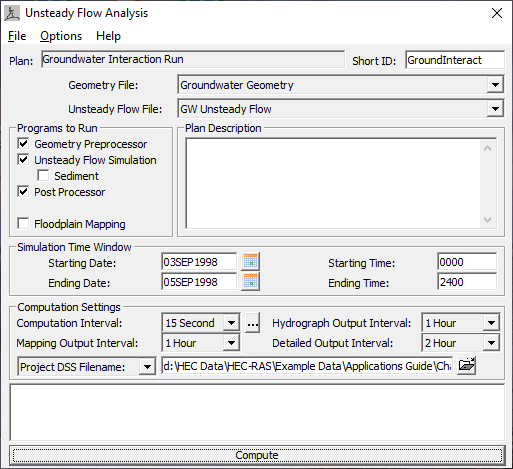
After the geometry and unsteady flow data have been completed an unsteady flow analysis may be initiated. Under the main program window Unsteady Flow Analysis was selected under the Run menu. This displayed the Unsteady Flow Analysis Window shown below. A plan was defined by selecting the Geometry File "Groundwater Geometry" and the Unsteady Flow File "GW Unsteady Flow." Under the File menu, Save Plan As was selected and the plan title was entered as "Groundwater Interaction Run." After entering the title of the plan a short identifier was entered as "GroundInteract" and the plan was saved.
Simulation Time Window
The simulation time window requires a beginning and ending date and time for simulation. The date must have a four digit year and was entered in the following format: 03SEP1998. The time field is entered in military time (i.e. 1 p.m. is entered as 1300). For this application the simulation time began and ended at 0000.
Computation Settings
The computation settings in the Unsteady Flow Analysis Window contain the following: the computational interval; hydrograph output interval; instantaneous profiles interval; and the name and path of the output DSS file.
For this example the computation interval was set to 5 minutes. The computation interval should be small enough to accurately describe the rise and fall of the floodwave. The hydrograph output interval was set to 1 hour. This interval defines the output of computed stage and flow hydrographs written to HEC-DSS. The detailed output interval was set to 2 hours, specifying the interval at which detailed hydraulic output will be computed by the post processor. It is suggested that this interval remain fairly large to reduce the amount of post processing and storage required. An appropriate path was selected for the output to DSS.
Programs to Run
There are three components used in performing an unsteady flow analysis within HEC-RAS: the geometric data preprocessor (HTAB); the unsteady flow simulator (UNET); and an output post processor. These three (plus Floodplain Mapping, which is not discussed in this application) can be found and turned on under the Programs to Run heading found on the Unsteady Flow Analysis window. The geometry pre-processor is used to speed up the unsteady flow calculations by processing the geometric data into a series of hydraulic property tables and rating curves. It is highly recommended that the user run the geometry pre-processor and examine hydraulic output for anomalies before running the unsteady flow simulator and the post-processor.
The unsteady flow simulation is what actually creates the stage and flow hydrographs. The program is a three step process that requires the tables from the geometry pre-processer, the boundary conditions, and flow data from the interface to operate.
The post processor is used to compute detailed hydraulic information for a set of user specified time lines during the unsteady flow simulation period. By running the post processor, the user will have all of the available plots and tables for unsteady flow that HEC-RAS normally produces for steady flow. The Geometry Preprocessor, Unsteady Flow Simulation, and Post Processor were all checked on. More information can be found in Example 17 Unsteady Flow Application.
Location of Stage and Flow Hydrographs
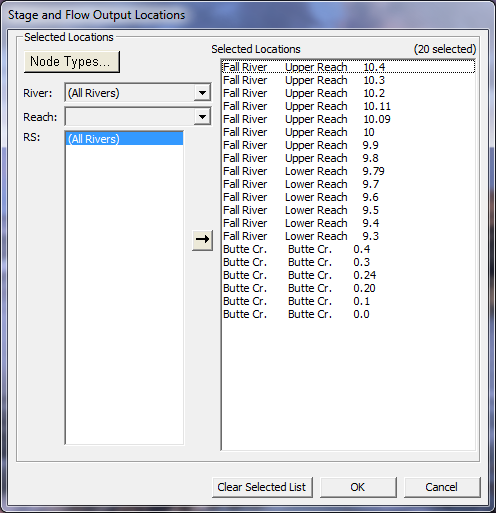
The user has the option of specifying locations to have hydrographs computed and available for display. The user may select individual cross sections, groups of cross sections, or entire reaches. From the Options menu on the Unsteady Flow Analysis Window, the Stage and Flow Output Locations option was selected, displaying the figure shown below. For this example "All Reaches" was selected. This option will compute hydrographs at every cross section in the data set. If the user is working with an extremely large data set, computation time and data storage can be reduced by only selecting the most essential cross sections for output.
Flow Distribution Locations
By selecting Flow Distribution Locations - from the Options menu on the Unsteady Flow Analysis Window - the user can specify locations they would like the program to calculate flow distribution output. The flow distribution option allows the user to subdivide the left overbank, main channel, and right overbank, for the purpose of computing additional hydraulic information. Once selected, a window should appear titled Set Locations for Flow Distribution shown below. The field Set Global Subsections was left alone because, for this example, it was not desired to compute flow distribution information for all the cross sections. A flow distribution was calculated at Fall River Lower Reach RS 9.6 by selecting these parameters from the corresponding fields under the Set Specific Locations Subsection Distribution. Next, the left overbank (LOB dropdown) was divided into two subsections, the channel into 10 subsections, and the right overbank (ROB dropdown) into two subsections. Once all the parameters were entered, the Set Selected Range was clicked, which populated the blank field below. OK was selected and all the changes were saved.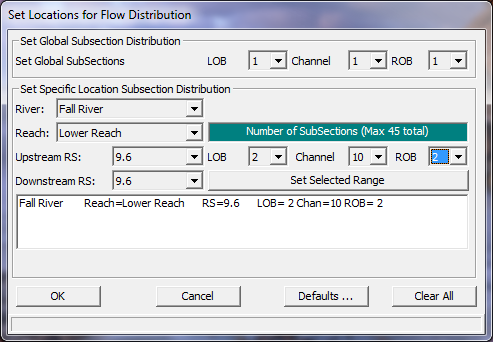
Output Analysis
The output from the simulation can be viewed from many different tables and graphs. However, pertinent information on the groundwater flow is best illustrated through viewing the stage and flow hydrographs. From the main program window, View and then Stage and Flow Hydrograph was selected. By selecting the Type menu on the Stage and Flow Hydrograph Window the user can view stage and flow hydrographs for the groundwater interaction by selecting Ground Water Interaction. Once selected, a window appeared showing the stage and flow hydrographs for one of the four groundwater interaction locations (below). From the GW dropdown menu, the "Storage Area: Upper Pond" was selected and its stage and flow hydrographs appeared below it (as seen in the figure below). The other three groundwater interflow locations can be viewed by selecting them from the same dropdown menu.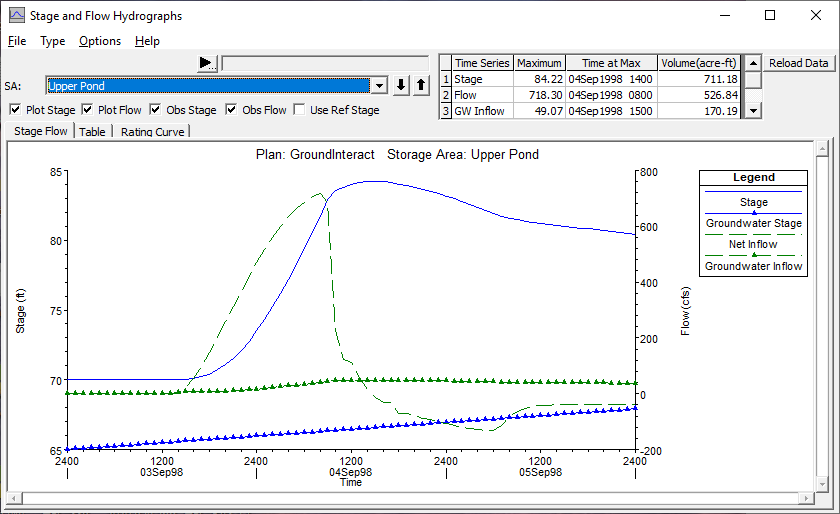
As seen in the figure above, the storage area stage begins to increase once the excess river flow of Upper Reach is diverted through the lateral structure. The storage area has a peak stage of 84.22 feet on September 4th at 1400 hours. Subsequently, the storage area's stage can be seen to decrease due to groundwater losses and flow entering back into Upper Reach. Initially, there was no groundwater flow between the storage area and the groundwater reservoir because the storage area was dry at the beginning of the simulation and the groundwater level was well below the initial elevation of Upper Pond (the SA elevation was 70 ft; while the GW elevation was 65 ft). Since the storage area had no water to transfer and the groundwater couldn't flow up gradient, the Groundwater Inflow curve on both the graph and table shows a value of zero until water begins to fill the storage area. The groundwater inflow reached its peak (49.07 cfs) on September 4th at 1500 hours when the hydraulic gradient between the two was the steepest.
DSS Plot
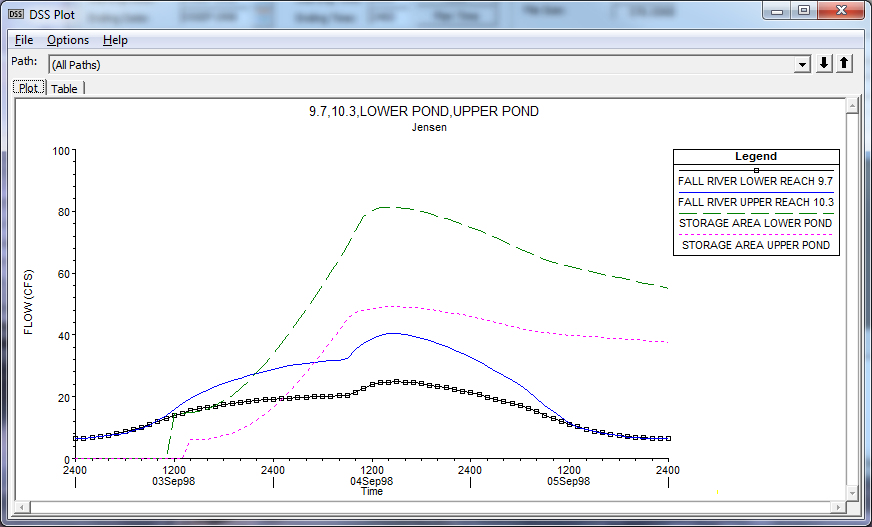
From the main program window, select the View | DSS Data menu item. Under Part C, the four cells titled "Flow-Groundwater Inflow" were selected (row numbers 201, 308, 317, & 321). These cells and their corresponding rows represent the data for the groundwater interflow hydrographs. By clicking each of the four rows, the program lists them in a field at the bottom of the window (see bottom of figure below). Once the values were populated in the field, the Plot/Tabulate Selected Pathname(s) was clicked. A new window titled DSS Plot appeared showing all four of the groundwater flow hydrographs as seen below.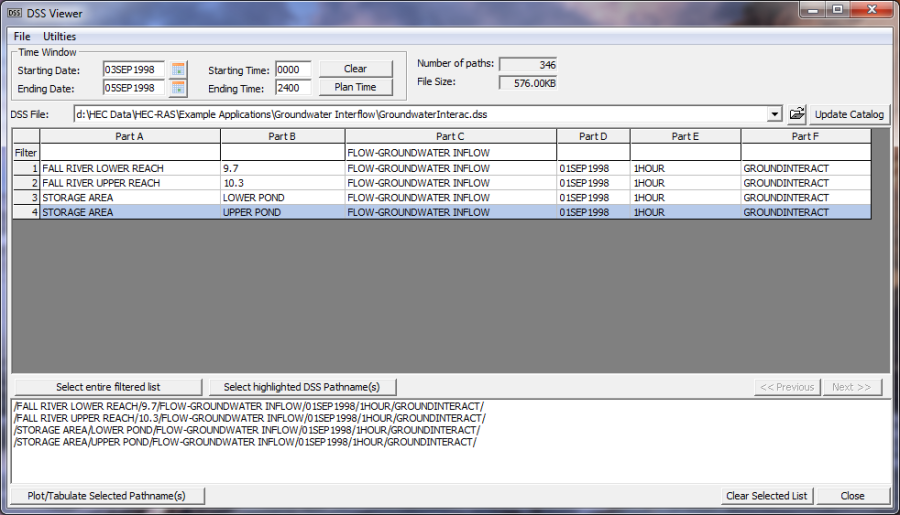
Summary
This unsteady flow example applies the groundwater interflow boundary condition to multiple reach and storage area locations. The program uses Darcy's equation to calculate the interchange between the surface waters and the groundwater. The user is shown how to input all necessary parameters and where to find the appropriate output data.