Download PDF
Download page Hager’s Lateral Weir Equation - Example 20.
Hager’s Lateral Weir Equation - Example 20
This example demonstrates how to model a lateral weir embankment using Hager's equation. Hager's equation is the same as the standard weir equation, except Hager's weir discharge coefficient is computed automatically based on physical and hydraulic properties. The primary and intended use of Hager's equation is for a designed lateral structure and channel, as often found in urban settings. Although using Hager's equation to model things such as a natural channel or a levee represented as a lateral weir is beyond the parameters of the equation, it can done; however, the results should be examined with caution and discernment. The modeler is referred to Chapter 6 of the User's Manual for further discussion on entering the geometric data for a weir and Chapter 7 of the Hydraulic Reference Manual for a more in-depth look at weir properties and equations.
To review the data files for this example, from the main HEC-RAS window, select File and then Open Project. Go to the directory in which you have installed the HEC-RAS example data sets. From the "Applications Guide\Example 20 - HagerLatWeir" subdirectory, select the project labeled "HagerLatWeir." This will open the project and activate the following files:
Plan: "Unsteady Sharp Crest S=10ft/mi"
Geometry:"Rect chan S=10ft/mi Sharp Crested"
Flow: "Hydrograph 8 to 17K"
Geometric Data
To view the geometric data for the river system, from the main program window select Edit and then Geometric Data. This will activate the Geometric Data Editor and display the river system schematic as shown in the figure below. The schematic displays the 21 river stations of "Brunner River," with river station 1000 as the upstream cross section and zero as the downstream cross section. 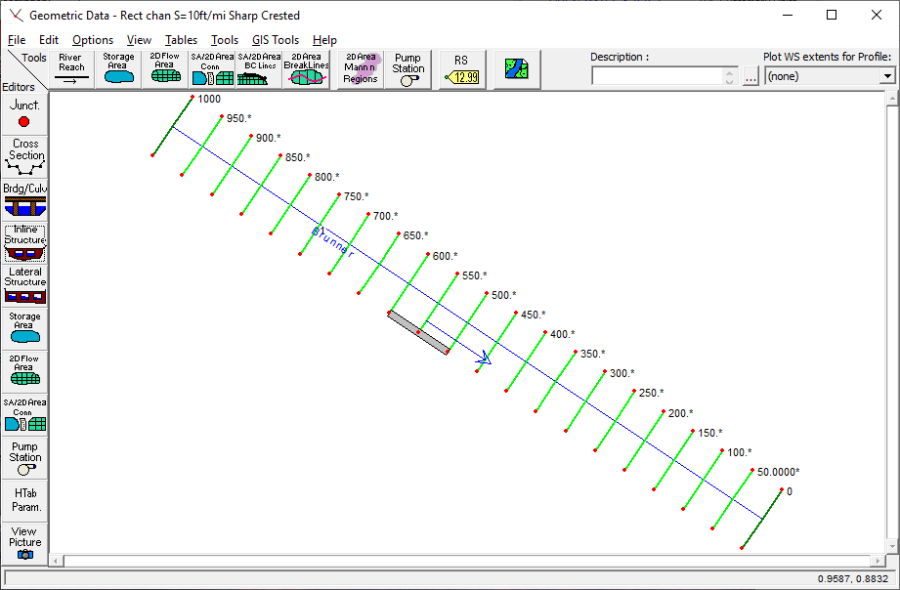
Cross Section Data
The cross section data consists of the X-Y coordinates, Manning's n values, contraction and expansion coefficients, etc. The user can view this data for each river station by selecting the Cross Section icon on the left side of the Geometric Data Editor. For this example, a lateral weir was added at river station 599 and will be discussed in the next section. The upstream and downstream rectangular cross sections were manually entered while the 19 river stations in between were interpolated. Although Brunner River is fictional, it is supposed to emulate a simplistic version of a rectangular channel and designed lateral structure that is often found in urban settings. For more information on entering cross section data and interpolating cross sections look to "Example 1 Critical Creek" and Chapter 6 of the User's Manual.
Lateral Structure
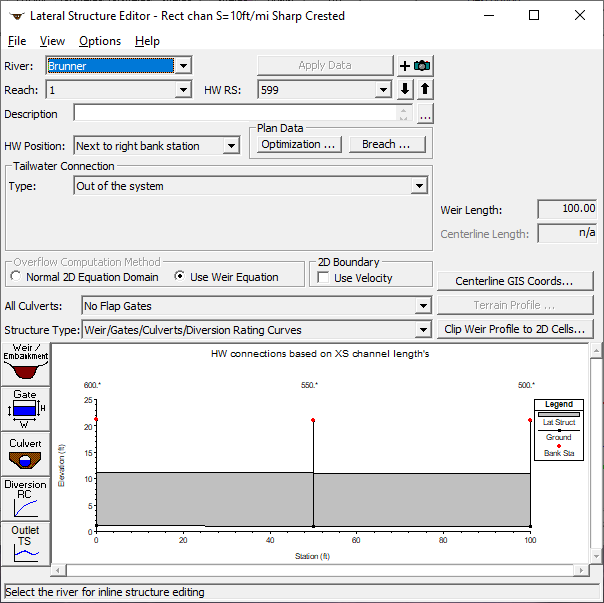
To add a lateral weir, the Lateral Structure icon was selected from the left side of the Geometric Data Editor. This activated the Lateral Structure Editor as shown in the figure below. The river "Brunner" and the reach "1" should already be selected. Then, Add a Lateral Structure was selected from the Options menu, and river station 599 was entered as the location for the weir. By entering the river station, the upstream end of the lateral weir is automatically placed between the cross section with the next highest river station upstream and the next lowest river station downstream. The schematic will display a profile plot of the lateral weir and any gates. When the lateral weir is first added, the schematic will be blank because the data have not yet been entered. The modeler can choose to place the lateral weir in the right or left overbank, or the right or left side of the channel by choosing from the drop down menu titled HW Position. For this problem, the weir has been placed "Next to right bank station." The Tailwater Connection type was chosen as "Out of the system" because the diverted flow left the region of interest that the model captured. "No Flap Gates" and "Weir/Gates/Culverts/Diversion Rating Curves" were selected from All Culverts and Structure Type, respectively.
Lateral Weir Embankment – Hager's Equation
To enter the data for the weir, the Weir/Embankment icon was selected from the left side of the Lateral Weir Data Editor. This activated the Lateral Weir/Embankment Editor as shown in the figure below. This editor is somewhat similar to the deck/roadway editor used for bridges and culverts. 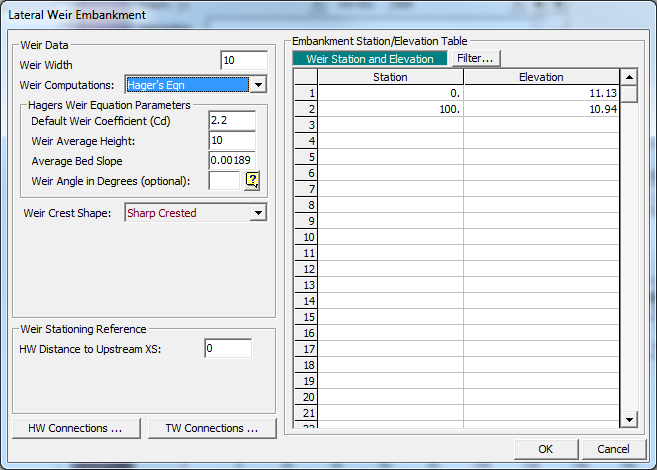
The left side of the editor has several fields and is where Hager's Weir Equation Parameters are entered. The first field is the Weir Width. This is width of the weir in the direction of flow over the weir (perpendicular to the flow in the river cross section). With the exception of calculating the broad crested weir coefficients with Hager's Equation, the weir width is not used for hydraulic computations, but is used by the GUI for graphical purposes. In this example, it has been set to 10 feet.
The next field is labeled Weir Computations. This field allows the user to select from two different equations to be used in computing the lateral weir flow: the Standard Weir Equation and Hager's Lateral Weir equation. Hager's Eqn was chosen.
There are four entries for the Hager's Weir Equation Parameters field: Default Weir Coefficient (Cd), Weir Average Height, Average Bed Slope, and Weir Angle in Degrees. The default weir coefficient (Cd) is used for the first iteration of calculations when computing Hager's equation. Although the weir value initially entered for Hager's equation will not be exactly the same as the final value used after the equation goes through the iterative process, it should represent a reasonable approximation. Typically, the default weir coefficient is lower than the prescribed coefficients for weirs of the same type. In this example, 2.2 is used for a sharp crested weir whereas the Hydraulic Reference Manual prescribes a weir coefficient of 3.1 – 3.3 for a sharp crested weir (Table 8-1 Typical Overflow Weir Coefficients). The coefficient is lowered because the weir equation assumes that the water flows perpendicular to the weir face, which is not the case for lateral weirs. Therefore, the coefficient is lower than normal to accurately account for the lower flows that will occur due to the variance in flow direction.
The Weir Average Height is the average height of the weir above the ground. The average height of the weir was 10 feet in this example.
The Average Bed Slope and Weir Angle in Degrees are both optional fields. If the user does not enter the average slope of the stream bed, then the program will compute the slope by estimating an average bed elevation for each cross section and then compute the slope from the average bed elevations. The Weir Angle in Degrees value is assumed to be zero (meaning the weir is parallel to the stream) if nothing is entered. If the weir is not parallel to the stream but instead angled towards the center of the river, an angle is required in the field (see the figure below to see how the angle is determined). 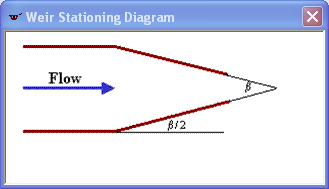
The next field is Weir Crest Shape, and the user can select one of the following four shapes: Broad Crested; Ogee; Sharp Crested; or Zero Height weir. For this example, sharp crested has been selected. If the Ogee had been selected, two additional fields and a Cd button would have popped up allowing the user to enter a Spillway Approach Height and a Design Energy Head. For the Ogee weir, the user can either enter a weir coefficient or have the program compute a weir coefficient by clicking on the Cd button.
The next category is Weir Stationing Reference. The field HW Distance to Upstream XS was set to zero feet, signifying that the lateral weir starts immediately at the upstream cross section. The field titled "TW flow goes" was left at the default setting and should have no influence on the results because the tailwater was set to go "Out of the system" on the Lateral Structure Editor.
The right side of the editor has two columns for the station and elevation data. These data points define the top of the lateral weir and are entered in the upstream to the downstream direction. Similar to cross section data, the stationing for the data can be based on any horizontal datum. In this example, the weir starts at an elevation of 11.13 feet at an arbitrary horizontal station of zero and concludes at an elevation of 10.94 feet at station 100.
The bottom left side of the editor has two buttons labeled "HW Connections" and "TW Connections", which are used to locate the lateral structure along the stream spatially. The upstream cross section is the first normal cross section immediately upstream of the lateral weir based on river stationing. (Between two normal river cross sections, there can be one or more lateral weirs.) In this example, the upstream cross section is 600* and the upstream end of the lateral weir is zero feet from this cross section. So the HW Distance has been entered as zero feet. The program will compute the distances to downstream cross sections based on where the lateral weir is located. In this example, the HW Position of the lateral weir has been specified as next to the right bank station (see above). This means that the program will use the main channel reach lengths of 50 feet. Therefore, the lateral weir, which is 100 feet long, intersects the downstream river station 500 and extends no farther. It should be noted that the lateral weir cannot cross more than 98 cross sections. If this happens, the user should break the lateral weir into two or more weirs that are physically adjacent. However, breaking the lateral weir into two or more weirs might cause the program to take longer to converge during the iterative process.
Unsteady Flow data
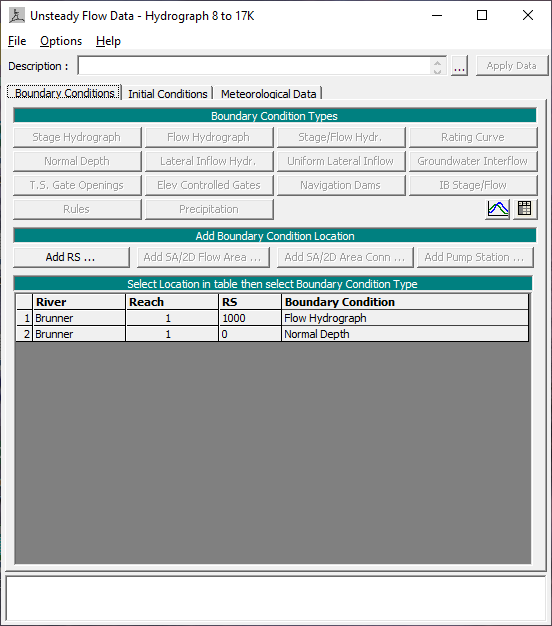
The user is required to enter boundary conditions and initial conditions for the system at the beginning of the simulation period. The Unsteady Flow Data Editor, shown in the figure below, was selected from the main program window under the Edit menu. In this example the upstream boundary condition was a flow hydrograph that's start time coincided with the simulation time. The downstream boundary condition was normal depth and a friction slope of 0.00189 was entered. The initial conditions cell was left blank, which causes HEC-RAS to use the first flow from the reach's flow hydrograph that was used for the upstream boundary condition. For additional information on unsteady flow data refer to Chapter 8 of the User's Manual, Performing an Unsteady Flow Analysis.
Unsteady Flow Analysis
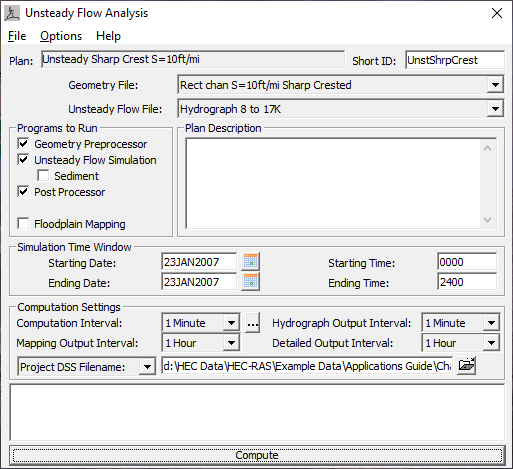
After the geometry and unsteady flow data have been completed an unsteady flow analysis may be initiated. Under the main program window Unsteady Flow Analysis was selected under the Run menu. This will display the Unsteady Flow Analysis Window shown in the figure below. A plan was defined by selecting the Geometry File "Rect chan S=10ft/mi Sharp Crested" and the Unsteady Flow File "Hydrographs 8 to 17K." Under the File menu, Save Plan As was selected and the plan title was entered as "Unsteady Sharp Crest S=10ft/mi." After entering the title of the plan a short identifier was entered as "UnstShrpCrest" and the plan was saved. The data was entered as seen in the figure below. For more information on the Simulation Time Window, Computation Settings, and Programs to Run refer to "Unsteady Flow Application – Example 17".
Output Analysis
For the analysis of the output, the water surface profiles, the lateral structure detailed output table, and the lateral structure profile summary table will be reviewed. Each of these is described in the following sections.
Water Surface Profiles
The water surface profiles are shown in the figure below This figure was activated from the main program window by selecting View and then Water Surface Profiles. The figure shows the peak water surface profile (Max WS) and the water surface created by the initial hydrograph flow. As seen in the profile plot, the lateral weir has negligible impact on the water surface profile of the river at lower flows but has a more significant impact at higher elevations when a higher percentage of the flow is diverted through it.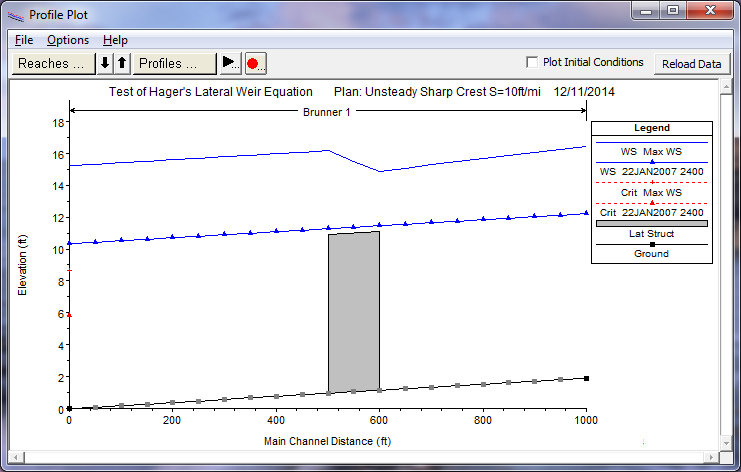
Lateral Structure Detailed Output Table
To review the detailed hydraulic results for the lateral structure the Lateral Structure type Detailed Output Table was activated and is show in the figure below. This table was activated from the main program window by selecting View, Detailed Output Table, Type, and then Lateral Structure. At the top of the table, River was selected as Brunner, the Reach was selected as "1" and the river station was 599 (the node for the lateral weir). The profile was selected as "Max WS."
The table shows the energy grade and water surface at the upstream and the downstream end of the weir. For this profile, the energy grade at the start of the lateral structure is 17.24 feet and 17.56 feet at the downstream end. The total flow upstream of the lateral structure is 17000 cfs, whereas the total flow downstream of the lateral structure is 14448.99 cfs (the lateral structure is spilling 2551.02 cfs or 15.01% of the flow). The weir coefficient calculated for the Max WS profile was 2.703. For lower flow profiles the weir coefficient was calculated to be a lower value (e.g. Profile 23JAN2007 2300 has a weir coefficient of 2.141). The user is encouraged to look through the results and compare the weir coefficient values calculated by Hager's equation for each time step. 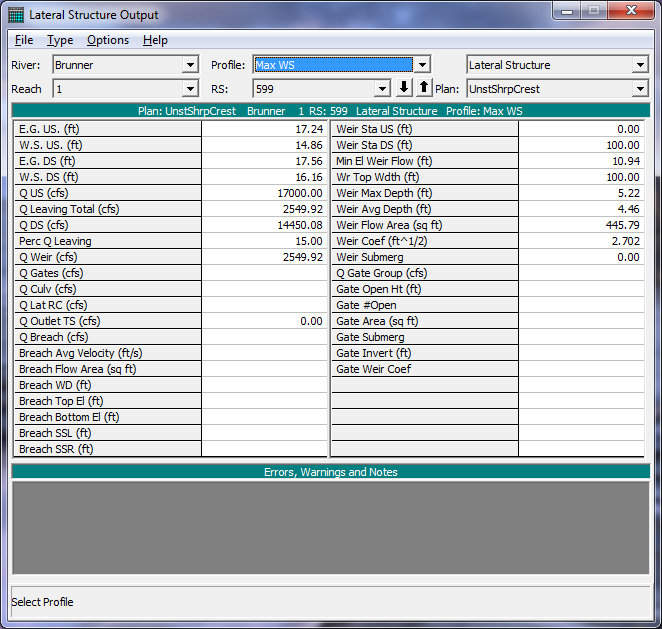
Lateral Structure Profile Summary Table
The Lateral Structure Only Profile Summary Table is shown in the figure below. This figure was activated from the main program window by selecting View, Profile Summary Table, Std. Tables, and then Lateral Structure. The figure displays the water surface elevations, energy grade line, and total weir flows for each of the profiles. This table is beneficial when the user wants to evaluate and compare several profiles at once. 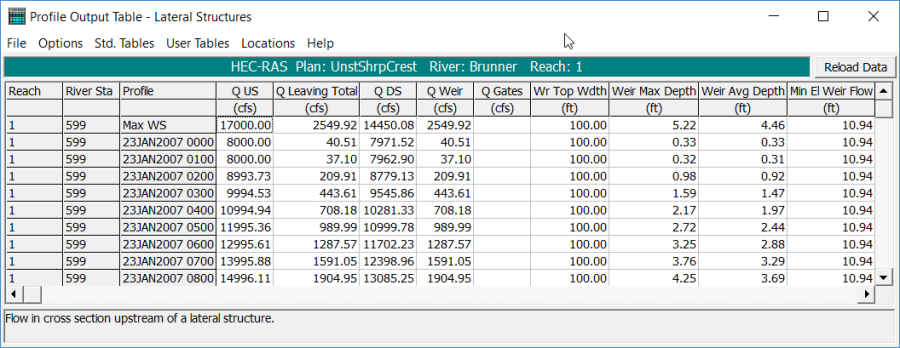
Summary
This example used Hager's Lateral Weir Equation to compute flow profiles for a designed rectangular channel and sharp crested lateral weir. It was seen how the Hager's Lateral Weir Equation adjust the weir coefficient for each profile to account for difference in hydraulic conditions. By reviewing the lateral weir tables and the water surface profiles and tables, the user can determine the amount of flow being diverted by the lateral weir and evaluate other hydraulic properties that are influenced by the presence of the weir.
