Download PDF
Download page Inline Structure - Example 12.
Inline Structure - Example 12
This example will demonstrate the use of HEC-RAS to analyze a river reach that contains an inline weir and gated spillways. For each inline structure location, the program can analyze up to 10 gate groups, with a maximum of 25 gates per group.
To perform the analysis, the user must enter the geometric data for the weir and gated spillway, along with the geometry of the river reach. Then, the user must set the number of gates that are open and the opening height of each gate group for each flow profile. The modeler is referred to Chapter 6 of the User's Manual for discussion on entering the geometric data for the weir and gated spillways, Chapter 7 of the User's Manual for entering the gate opening flow data, and Chapter 8 of the Hydraulic Reference Manual for the hydraulic analysis procedures for analyzing the flow through the gate openings and over the weir.
To review the data files for this example, from the main HEC-RAS window, select File and then Open Project. Go to the directory in which you have installed the HEC-RAS example data sets. From the "Steady Examples" subdirectory, select the project labeled "Inline structure - Example 12." This will open the project and activate the following files:
Plan: "Gated Spillway"
Geometry: "Gate Geometry with 3 Gate Groups"
Flow: "7 Flow Profiles"
 Example 12 - Inline Structure.zip
Geometric Data
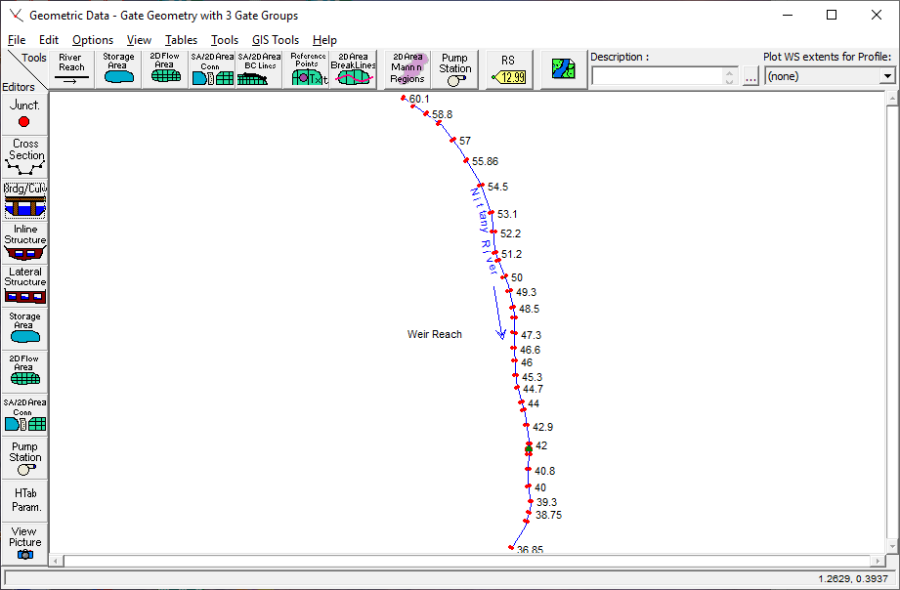
To view the geometric data for the river system, from the main program window select Edit and then Geometric Data. This will activate the Geometric Data Editor and display the river system schematic as shown in the figure below. The schematic displays the 35 river stations of the reach "Weir Reach" on "Nittany River", with river station 60.1 as the upstream cross section and 36.85 as the downstream cross section.
Cross Section Data
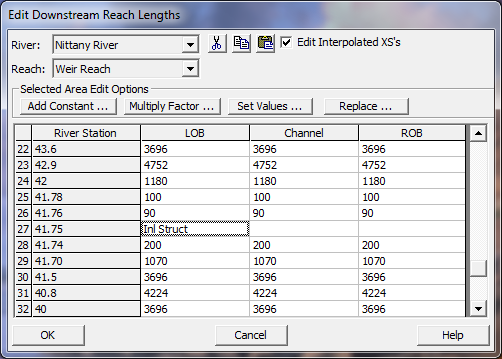
The cross section data consists of the X-Y coordinates, Manning's n values, contraction and expansion coefficients, etc. The user can view this data for each river station by selecting the Cross Section icon on the left side of the Geometric Data Editor. For this example, an inline structure was added at river station 41.75 and will be discussed in the next section. The top figure below displays the reach lengths in the vicinity of the inline structure and was activated by selecting Tables and then Reach Lengths from the Geometric Data Editor.
Inline Structure
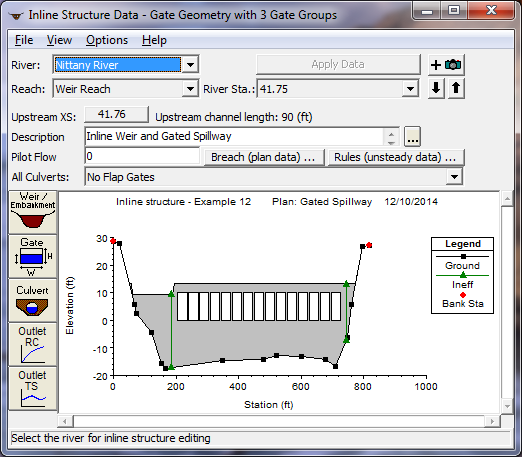
To add an inline structure, the Inline Structure icon was selected from the left side of the Geometric Data Editor. This activated the Inline Structure Data Editor as shown in the bottom figure below. First the reach "Weir Reach" was selected. Then, Options and Add an Inline Structure were selected and river station 41.75 was entered as the location for the weir. The schematic then displayed the cross section data for the river station immediately upstream of the weir location: namely river station 41.76 for this example. A description for the weir was then entered as "Inline Weir and Spillway."
To enter the data for the weir, the Weir/Embankment icon was selected from the left side of the Inline Structure Data Editor. This activated the Inline Structure Station Elevation Data Editor as shown in the figure below. This editor is similar to the deck/roadway editor used for bridges and culverts.
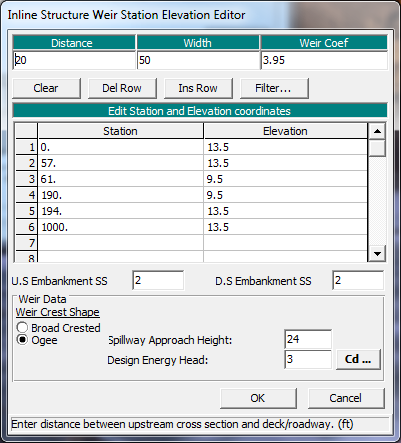
The top row of the editor consists of three data entry fields. For the first field, the user must enter the Distance from the upstream cross section (41.76) to the upstream side of the weir. For this example, this distance was 20 feet. Next, the Width of the weir was entered as 50 feet. This is a total distance of 70 feet. From the figure titled, "Reach Length Table for Nittany River', it can be seen that the distance from river station 41.76 to 41.74 is 90 feet. Therefore, the distance from the downstream end of the weir to cross-section 41.74 is 20 feet. The last field in the top row of the editor is the Weir Coefficient. This will be discussed shortly.
The central portion of the editor consists of a table in which the user must enter the station and elevation data for the weir. For this example, the emergency spillway is located on the left at an elevation of 9.5 feet from Station 61 to 190; however, the entire top-of-dam is defined. The first station of the weir was entered as 0 and the last station is at 1000 feet. With these weir stations and elevation, the program will block out the entire area below the weir crest. In this manner, the data entry is similar as that for a culvert.
Additionally, it should be noted that the weir station values of 0 and 1000 occur beyond the limits of the cross section data. As for the bridge and culvert routines, the program will automatically "clip off" the excess area so that the weir coincides with the cross section geometry.
The next fields are for the upstream and downstream embankment side slopes. For this example, the slope of two was entered for the US and DS Embankment S.S. fields.
At the bottom of the editor are several other required variables. The Min Weir Flow Elevation was left blank which implies that the lowest elevation of the weir will be used to determine when weir flow begins to occur. Finally, the shape of the weir was entered as "Ogee" for the Submergence criteria. When ogee was selected, the editor expanded to allow for two more fields of entry. These fields are the Spillway Approach Height and Design Energy Head. The approach height was entered as 24 feet and the design head was 3 feet for the ogee shape. To determine the weir coefficient with these design parameters, the Cd button was selected and the program calculated a coefficient of 3.95, as shown in the figure below.
The "Yes" button was selected and then the coefficient appeared at the top of the Inline Structure Station Elevation Data Editor in the Weir Coefficient field. If the weir shape had been selected as "Broad Crested", the user is required to enter the value of the weir coefficient. This completed the data entry for the weir. Next, the data for the gates were entered.

Gated Spillways
To enter the data for the gates, the Gate icon was selected from the Inline Structure Data Editor ("Inline Structure Data Editor"). This activated the Gate Editor as shown in the figure below. For this example, 15 radial gates were entered. The gates were divided into 3 groups, with 5 gates in each group. The gates were divided into three groups to allow for flexibility when setting the gate opening heights. This will be discussed further when the opening heights are set in the steady flow data editor.
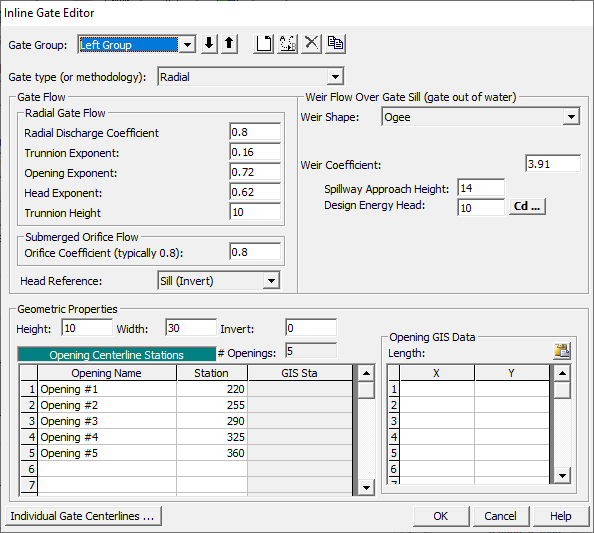
When the Gate Editor was activated, the first gate was labeled as "Gate #1." For this example, the Rename button was selected and the label "Left Group" was entered. Next, the Height, Width, and Invert for the gates of the Left Group were entered as 10, 30, and 0 feet, respectively. On the lower left side of the editor, the centerline stations for the five gates in the "Left Group" were entered as shown in the figure above. As these values were entered, the counter field # Openings increased to represent the total number of gates for the group (5 for this example).
The remaining portion of the editor is divided into two sections, one for the Gate Flow data and one for Weir Flow data. The gate data is used when the water surface upstream of the gate is greater than 1.25 times the gate opening (as measured from the gate invert). At this water surface elevation, the gate is controlling the flow rate. The weir data is the shape of the weir under the gate and is used when the upstream water surface is less than or equal to the gate opening. At this water surface elevation, the weir under the gate is controlling the flow through the gate opening (i.e., the water is not in contact with the gate).
For the gate data, the first field is the Gate Type. By selecting the down arrow, the type "Radial" was chosen. When the gate type was selected, the Radial Discharge Coefficient, Trunnion Exponent, Opening Exponent, Head Exponent, and Trunnion Height values were automatically set to 0.80, 0.16, 0.72, 0.62, and 10.0 respectively. The orifice coefficient of 0.8 was entered for fully submerged flow conditions. Additionally, the head reference for the gate equation defaults to the "Sill (invert)" of the gate opening. This is appropriate for gates that release water to a channel, rather than to the free atmosphere.
For the Weir Flow data, the Weir Shape was selected as "Ogee". This caused the editor to add the data fields for Spillway Approach Height and Design Energy Head. The distances of 14 and 3 feet were then entered for each of these fields, respectively. Finally, the Cd button was selected and a window appeared similar to the figure, "Ogee Weir Shape Coefficient", with a coefficient of 3.91. The "Yes" button was selected and the weir coefficient appeared in the weir data area at the bottom of the Gate Editor.
This completed the data entry for the gates in the "Left Group." Next, the Add button at the top of the Gate Editor was selected and this added another gate group. The group was renamed to "Center Group" and the data for 5 new gates were entered exactly as for the Left Group, except for the centerline stations. Finally, a third gate group was added and renamed "Right Group," with the data entry as for the two previous groups with new centerline stations.
The OK button was selected at the bottom of the Gate Editor and the gates appeared on the Inline Structure Data Editor as shown in the figure "Inline Structure Data Editor" above. (Note: The ineffective flow areas will be entered subsequently.) At this point, the user should zoom in on the gate openings to ensure that they do not overlap and appear as intended. The Inline Structure Data Editor was then closed.
Ineffective Flow Areas
As performed for bridges and culverts, ineffective flow areas should be entered on the cross sections that bound the inline structure. For this example, the cross section that is upstream of the structure is 41.76 and the cross section downstream of the structure is 41.74. To enter the ineffective flow areas, the Cross Section icon was selected from the Geometric Data Editor (first figure). Then, river station 41.76 was selected and Ineffective Flow Areas was selected from the Options menu. This activated the Ineffective Flow Editor as shown in the figure below.
The distance from the inline structure (river station 41.75) to river station 41.76 is 20 feet. The left edge of the gates at river station 41.75 is 205. Therefore, the left ineffective flow area was set to begin at 205 - 20 = 185. Similarly, the right ineffective flow area was set at 745 (= 725 + 20). The elevation on the left is 9.5 feet, at the top of the spillway, and the right is 13.5, the top-of-dam. The OK button on the editor was selected and similar ineffective flow areas were entered at river station 41.74.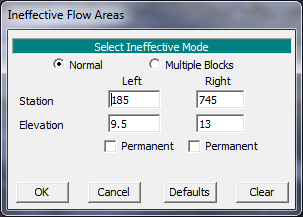
Cross Section Placement
The final component of the geometric data concerns the placement of the cross sections in reference to the inline structure. As for bridges and culverts, the flow will contract to enter the gate openings and expand after the exiting the gate openings. The program will use 4 cross sections located on both sides of the structure to define the contraction and expansion of the flow through the structure. To provide guidance for the expansion reach length and contraction reach length, the tables in Appendix B of the Hydraulic Reference Manual were utilized. These tables were developed based on data for flow through bridges, however, they were used to provide general guidance.
To determine the expansion reach length, the following data was used:
| b=520 \\ B=660 \\ b/B=0.79 \\ S=0.4 \\ n_{ob}/n_c = 1 |
where:
b
= gate openings area, ft
B = floodplain width, ft
S = channel slope, ft/mi
n_{ob} = Manning's n value of the overbank at river station 41.78
n_{c} = Manning's n value of the main channel at river station 41.78
From Table B.1, the expansion ratio (ER) is approximately 2.0. Using an average length of obstruction (Lobs) of approximately 100 feet yields an expansion reach length (Le) of:
| L_e = \left( ER \right) \left( L_{obs} \right) = (2.0)(100) = 200 \ feet |
The expansion reach length is measured downstream from river station 41.74. Therefore, a cross section (41.70) was placed 200 feet downstream from river station 41.74. River station 41.70 represents the cross section where the flow is fully expanded.
For the contraction reach length, the contraction ratio (CR) was obtained as 1.0 from Table B.2. With this value, the contraction reach length (Lc) is:
| L_c = \left( CR \right) \left( L_{obs} \right) = (1.0)(100) = 100 \ feet |
The contraction reach length is measured upstream from river station 41.76. Therefore, a cross section (41.78) was placed 100 feet upstream from river station 41.76. River station 41.78 represents the cross section where the flow lines are parallel.
As a final note, the values for b, B, and Lobs were approximated for the flow rate of 75,000 cfs. As the flow rate changes, the length of expansion and contraction would also change. For this example, the values that were determined for this flow rate were held constant for all of the flow rates.
This concluded the entry for all of the geometric data. At this point, the geometric data was saved as the file "Gate Geometry with 3 Gate Groups." Next, the flow data was entered.
Steady Flow Data
The flow data consisted of three components: the flow rates for each profile; the boundary conditions; and the gate elevation settings. Each of these components are described in the following sections.
Flow Profiles
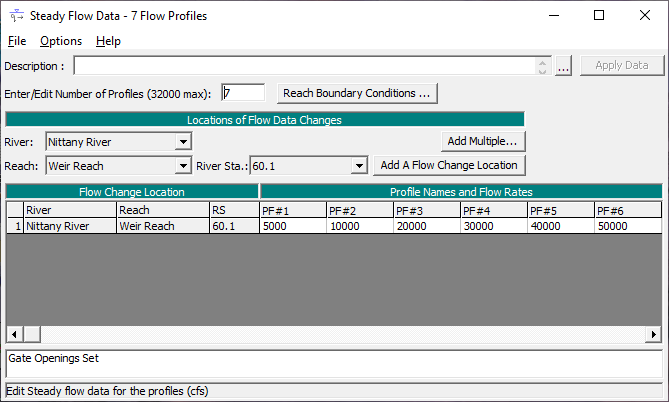
To enter the flow data, the Steady Flow Data Editor (as shown in the figure below) was activated from the main program window by selecting Edit and then Steady Flow Data. For this example, the number of flow profiles was selected as 7. When this number was entered, the table in the central portion of the editor expanded to provide 7 columns of data entry. The river reach "Weir Reach" (the only reach for this example) and the upstream river station of 60.1 appeared (by default) as the location for the flow data. The seven flow values of 5000, 10000, 20000, 30000, 40000, 50000, and 75000 cfs were entered as shown in the following figure. No additional flow change locations were entered.
Boundary Conditions
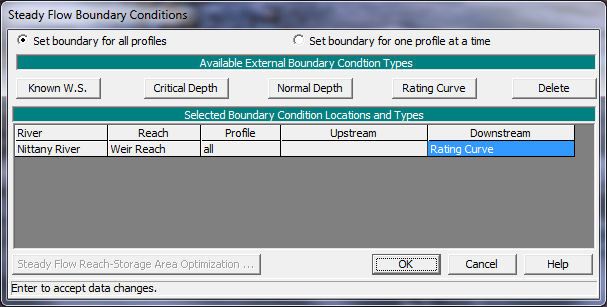
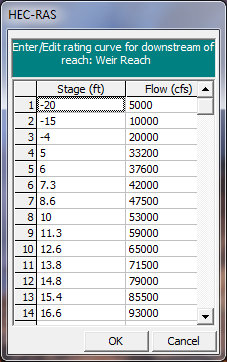
After the flow data was entered, the boundary conditions were entered by selecting the Reach Boundary Conditions button at the top of the Steady Flow Data Editor. This activated the Boundary Conditions Editor as shown in the top figure below. For this example, a subcritical analysis was performed. Therefore, boundary conditions were entered at the downstream end of the river reach. The field under Downstream was selected and then Rating Curve was chosen. This activated the Rating Curve Editor as shown in the bottom figure below. The flow values and corresponding water surface elevations were then entered in the editor, a portion of which is shown in the bottom figure below.
(Note: If the flow rate for a profile is less than the first rating curve data point, then the program will linearly interpolate a starting elevation between the first rating curve point and the downstream cross section invert.) After the data were entered, the OK button was selected to close the editor. This caused the title "Rating Curve" to appear in the "Downstream" field, as shown in the top figure below. The OK button was then selected on the Boundary Conditions Editor.
Gate Openings
The final data entry for the analysis was the gate opening heights. To enter this data, from the Steady Flow Data Editor, Options and then Inline Spillway Gate Openings were selected. This activated the Inline Spillway Gate Openings Editor as shown in below.
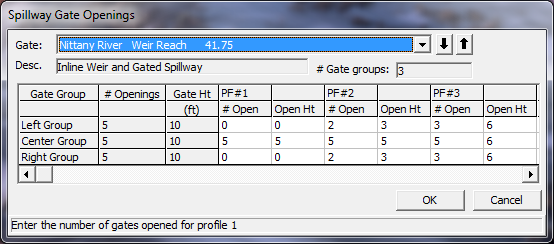
At the top portion of the editor, the River "Nittany River," Reach "Weir Reach" and the River Station "41.75" were selected. The Description is the same as was entered in the Inline Structure Data Editor (see third figure in the Geometric Data Section). The # Gate Groups field shows that there are 3 gate groups at this river station. The table in the central portion of the editor has 3 rows for this example, one row for each of the gate groups. The first column lists the descriptions for the gate groups, as they were named in the Gate Editor (see the Geometric Data Section). The second column displays the number of gate openings for each gate group (5 for each gate group for this example). The third column displays the maximum gate height for each gate group (10 feet for each gate group for this example).
The remaining portion of the editor consists of entry fields for the number of gates opened and the opening heights of the gates for each flow profile. For this example, for profile 2, the Left and Right Gate Groups were set to have 2 gates open, each with an opening height of 3 feet. The Center Group was set to have 5 gates open, each at 5 feet. Since the gates were entered as three groups, the flexibility existed to have each gate group opened at different heights. If all 15 gates had been entered as only one group, then all of the gates that were open would have to have been set at the same opening height.
The user can toggle across the table to view the number of gates open and the gate opening heights for all of the profiles. During the analysis of the output, the various gate settings will be discussed. This concluded the data entry for this example. At this point, the OK button at the bottom of the editor was selected and the flow data was saved as "7 Flow Profiles."
Steady Flow Data Analysis
After all of the data had been entered, the steady flow analysis was performed by activating the Steady Flow Analysis Window. This window was activated from the main program window by selecting Run and then Steady Flow Analysis, and is shown in the figure below.
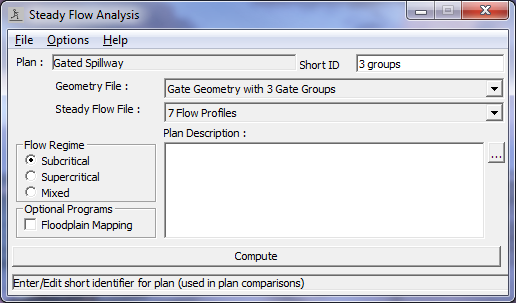
First, the Short ID was entered as "3 groups." The geometry file was then selected as "Gate Geometry with 3 Gate Groups" and the flow file was "8 Flow Profiles." Next, the Flow Regime was selected as "Subcritical." Then, File and Save Plan As were chosen and the information was saved as the plan "Gated Spillway." This plan name then appeared on the Steady Flow Analysis Window, as well as on the main program window. Finally, the COMPUTE button was selected to perform the analysis.
Output Analysis
For the analysis of the output, the water surface profiles, the inline structure type cross section table, and the inline structure type profile table will be reviewed. Each of these are discussed in the following sections.
Water Surface Profiles
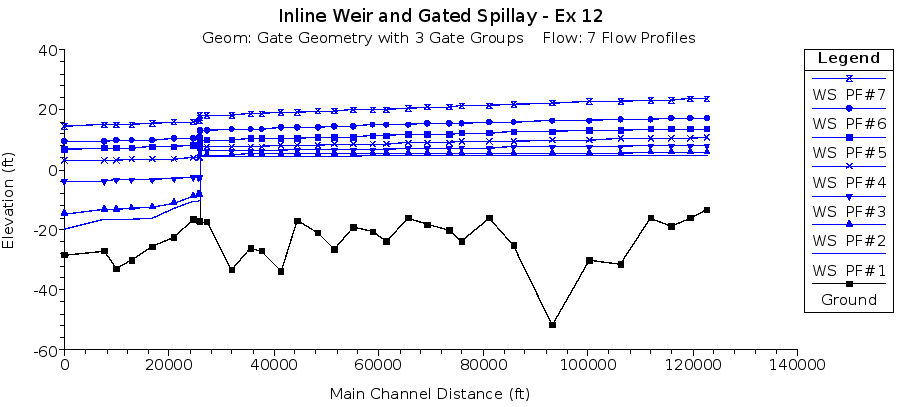
The water surface profiles are shown in the figure below. This figure was activated from the main program window by selecting View and then Water Surface Profiles. The figure shows all 7 of the flow profiles.
Inline Structure Detailed Output Table
To review the flow parameters through the gate openings, the Inline Structure type Detailed Output Table was activated and is show in the figure below. This table was activated from the main program window by selecting View, Detailed Output Table, Type, and then Inline Structure.
At the top of the table, the Reach was selected as "Weir Reach" and the river station was 41.75 (the cross section for the inline structure). The profile was selected as "1" and the Gate ID was selected as "Center Group." For this profile, the Left and Right Gate Groups did not have any gates opened; therefore, only the Center Group will be discussed.
The Center Group had been set (as shown in Steady Flow Data section) to have 5 gates open at a height of 5 feet. The figure below displays this information in the right column. With a gate invert of -10 and a gate opening height of 5, the top of the gate opening was at -5 feet. The left side of the figure shows that the water surface at river station 41.76 was at an elevation of 4.56 feet. Therefore, the water surface did not come into contact with the top of the gate opening and weir flow through the gate openings occurred. The weir data that was use to calculate the upstream energy grade line was the data that had been entered in the Gate Editor (see the Geometry Data section), not the weir data as entered in the Inline Structure Station Elevation Data Editor (see the Geometry Data section). Additionally, the Gate Area field shows a gate flow area of 136.81 ft2. With a gate opening height of 5 feet and a width of 30 feet, the total gate opening area is 150 ft2. This shows that the gate area was not flowing full.
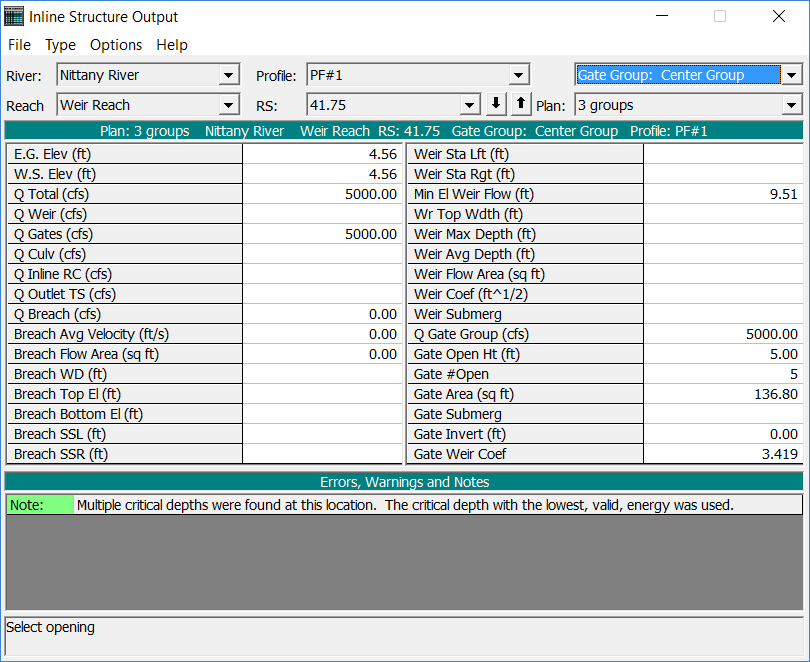
To review the data for the second profile, the down arrow for the Profile field was depressed and "PF#2" was selected. The Inline Structure Type Detailed Output Table for profile 2 is shown in the figure below. For this profile for the Center Group, 5 gates were set to an opening height of 5 feet, as before (as shown in the right column of the table).
With an invert at 0 and an opening height of 5, the top of the gate openings were at an elevation of 5.00 feet. The upstream water surface elevation is shown to be at 4.05 feet, which is above the top of the gate openings. Additionally, the Gate Area field shows a flow area of 121.45 ft2 (for each gate opening). This equals the gate opening area (4.05 ft high x 30 feet wide) in which water was flowing. The depth of flow (as measured from the invert of the gate) was 4.05 feet, which is less than the gate opening height. Therefore, the flow was still being computed as weir flow.
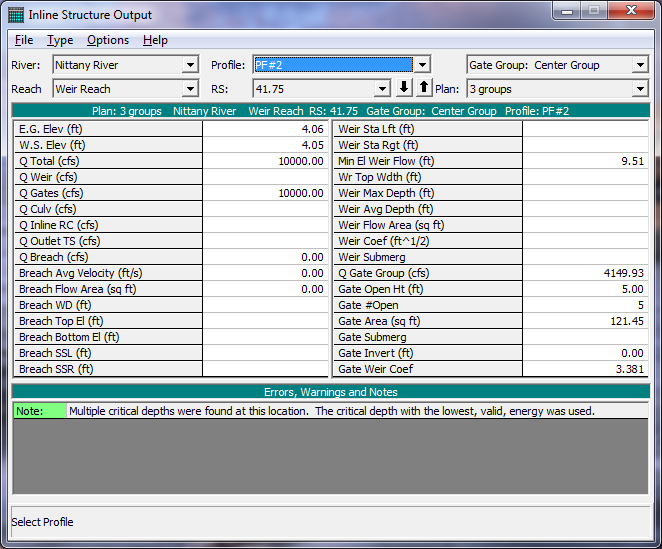
Additionally, for the second profile, the Left and Right Gate Groups were each set to have 2 gates open, at a height of 3 feet. By depressing the arrow for the Gate ID field, the Left (or Right) group can be selected. For this group, gate-controlled flow occurred through the gate openings because the top of the gate openings were at an elevation of 3 feet. The field Gate Q Total shows that 2926.11 cfs was the total flow through the gate openings. Since the Left and Right groups had the same gate settings, the total flow in the cross section was 2 times the flow in the Left Group plus the flow in the Center Group = 2(2925.04) + 4149.93 = 10000 cfs, the total flow rate for the second profile.
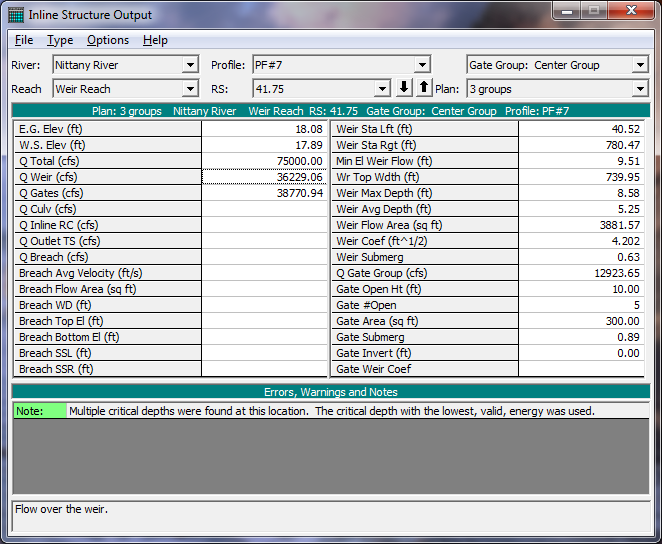
Similarly, for the remaining profiles, the flows through the gate openings can be reviewed by pressing the down arrow next to the Profile: box. The Weir Type Detailed Output Table for profile 7 is shown in the figure below. For this profile, the weir flow data is shown on the left side of the table, based on the data as entered in the Inline Structure Station Elevation Data Editor (see 2022-02-08_13-40-16_Geometric Data (Ex12)). The total weir flow is shown to be 36229.06 cfs. Because the Left, Center, and Right Gate Groups were entered with the same gate settings, the total flow in the cross section is 3(12923.65) + 36229.06 = 75,000 cfs, the total flow for the profile. The table also displays other weir data such as the left and right station, average depth, and submergence.
Inline Structure Profile Summary Table
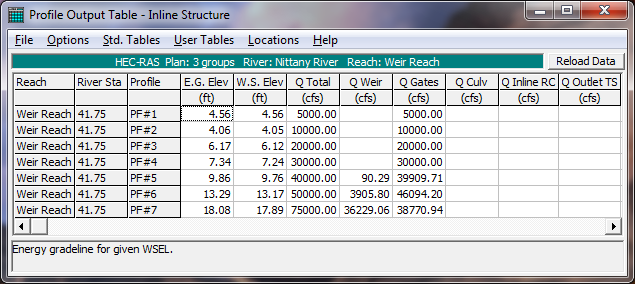
Finally, the Inline Structure Profile Summary Table is shown in the figure below. This figure was activated from the main program window by selecting View, Profile Table, Std. Tables, and then Inline Structure. The figure displays the water surface elevations, energy grade line, and total weir and gate flows for each of the profiles. This table shows that weir flow only occurred for the last two profiles, and can be used to assist in the determination of the gate settings to adjust the amount of weir flow and gate flow.
Summary
This example computed 7 flow profiles for the reach of Nittany River, which included an inline weir and spillway. The gates for the inline structure were divided into 3 groups, with 5 gates in each group. This provided for flexibility when setting the number of gates opened and the gate opening heights for each profile because the opening heights must be the same for all of the gates opened in each gate group.
By reviewing the water surface profiles and the inline structure tables, the user can determine the type of flow through the gate openings and determine if adjustments to the gate settings are required to provide for a selected water surface elevation. The Inline Structure Output table provides detailed output for each gate group, for any profile. The Profile Summary Output Table - Inline Structure provides upstream energy and water surface elevations along with the total weir and gate flow. For the maximum discharge profile, the entire weir profile is overflowing, a condition that may not be structurally sound.