Download PDF
Download page Multiple Plans - Example 7.
Multiple Plans - Example 7
This example will demonstrate the use of working with multiple plans. Each river hydraulics application constitutes a project, which is a collection of files that are associated with the application. A project is divided into one or more plans. Each plan associates specific files of the project to be grouped together. Therefore, each plan can represent a development stage or analysis phase of the project.
Initially, this example will briefly discuss the elements of a project and the elements of a plan. The modeler is referred to Chapter 5 of the User's Manual for a further discussion on working with projects and a discussion of the files that comprise a plan. Specifically, this example will illustrate the use of multiple plans by analyzing the existing geometric conditions of the river reach and then analyzing a proposed change to the geometry. To review the data files for this example, from the main HEC-RAS window, select File and then Open Project. Go to the directory in which you have installed the HEC-RAS example data sets. From the "Applications Guide\Example 7 – Multiple Plans" subdirectory, select the project labeled "Napa Cr. Bridge Project - Example 7." This will open the project and activate the following files:
Plan: "Existing Plan Data"
Geometry:"Existing Geometry"
Flow: "100 year flow"
 Example 7 - Multiple Plans.zip
Elements of a Project
A project is comprised of all of the files that are used to develop a model, as well as a list of default variables that are used for the analysis. The files that constitute the project are listed in the table below. For each file, the table lists the file type, the file extension, and the method of creation of the files (by the user or by the program).
| Project Files | ||
File Type | Extension | Created By: |
Plan | .P## | user |
Note: ## refers to an extension number from 01 to 99.
As the file types are created, the program will number the extensions in consecutive order starting at 01. The run and output file extension numbers will always coincide with the extension number of the plan that the program used to create the files. Finally, the project also specifies the default variables. These variables include the system of units (English or SI) and the contraction and expansion coefficients. These variables can be changed by the user through the program interface.
Elements of a Plan
A project is comprised of one or more plans. Each plan contains: a short identifier; a list of files associated with the plan; and a description of the simulation options that were set for the analysis. Each of these three items are discussed as follows.
The short identifier is entered in the Steady Flow Analysis Window. This identifier appears while viewing the output. It is used to identify the output from a specific plan while viewing the output from multiple plans. If this identifier is changed, then the user must re-compute the plan in order for the output file to reflect the change.
The main function of the plan is to associate a group of files. The plan can associate one file extension from each type of file. For this example, there were two geometry files and one steady flow file that were created. The first geometry file was created to describe the existing conditions of the river reach and had an extension ".G01". The second geometry file described the proposed geometry of a new bridge along the same river reach and, since it was the second geometry file that was created, it had an extension ".G02."
Finally, a steady flow data file was created that contained the 100-year flow event. This steady flow file had an extension ".F01."
For this project, it was desired to compare the results of the existing geometry to the proposed geometry for the same flow event. Therefore, two plans were created. The first plan associated the existing geometry file (.G01) with the 100-year steady flow data (.F01). The second plan associated the proposed geometry (.G02) with the same 100-year steady flow data (.F01). In this manner, a second steady flow data file with the same information was not required to be developed. Instead, the second plan merely associated the second geometry file with the original steady flow data file. After both plans were computed, the output from the first plan (.O01) and the output from the second plan (.O02) were then easily compared graphically and in tabular form. This will be discussed shortly. Additionally, mapping of both plans can be accomplished in HEC-RAS Mapper (.P01.hdf and P02.hdf).
It should be noted that a plan cannot contain a combination of a steady flow and an unsteady flow file. A plan can only include one type of file that contains flow information.
Lastly, the plan contains a description of the simulation options that were set for the analysis. These simulation options include: maximum tolerances for calculations, maximum number of iterations, log output level, friction slope method, etc. These simulation options can be changed by the user.
Existing Conditions Analysis
The main focus of the remaining discussion will concentrate on the method of creating multiple plans and analyzing multiple plan output. The geometry and steady flow data files developed for this example are briefly discussed in the following sections.
Existing Conditions Geometry
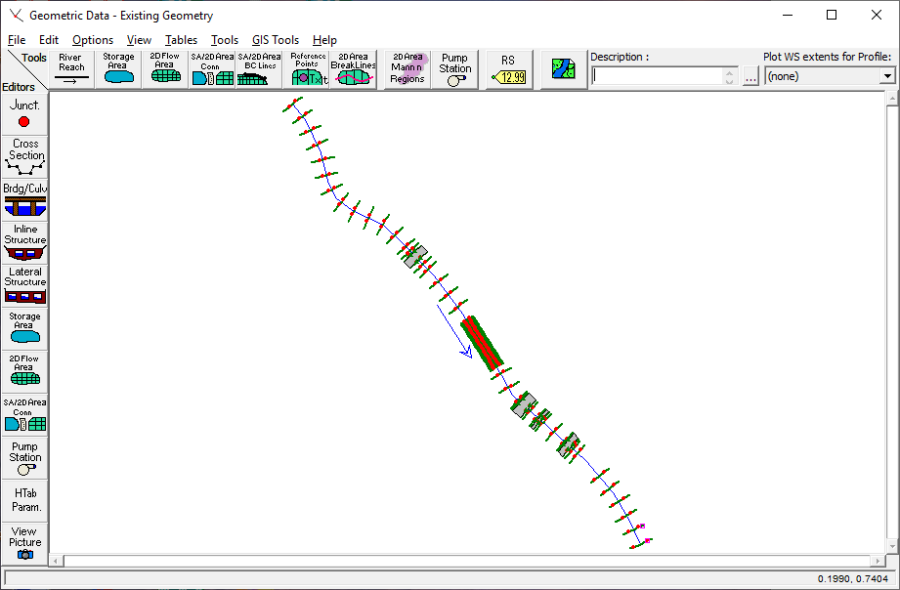
A geometry file was created that modeled the existing conditions for a reach of Napa Creek. This reach is a manmade channel with four bridge crossings. To view the river schematic, from the main program window select Edit and then Geometric Data. This will activate the Geometric Data Editor and display the river system schematic as shown in the figure below.
The river reach is defined by 84 river stations. The user can view the geometric data for each river station by selecting the Cross Section icon from the Geometric Data Editor. The data for each river station is comprised of : a description; X and Y coordinates; downstream reach lengths, Manning's n values; main channel bank stations; and contraction and expansion coefficients.
Additionally, a levee was placed on the left side river stations 200 and 300 and ineffective flow areas were established at river stations: 956 and 1002; 1208 and 1229; 1318 and 1383; 2484 and 2540. Each of these four groupings are for the four bridge locations in the river reach. Finally, the expansion and contraction reach lengths for each bridge were estimated using the expansion and contraction ratios obtained from Table B.1 and B.2 in Appendix B of the Hydraulic Reference Manual.
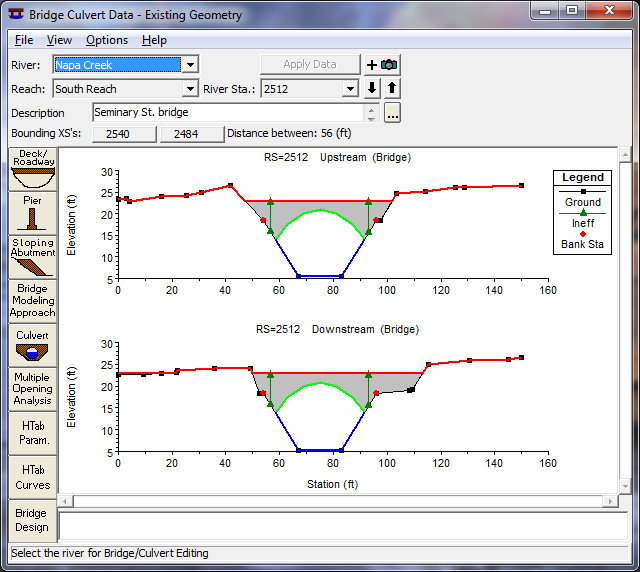
The focus of this project is to replace the existing bridge structure located at river station 2512. To view the existing bridge, from the Geometric Data Editor select the Bridge/Culvert icon and toggle to river station 2512. This will display the Seminary Street Bridge at river station 2512 as shown in the figure below.
The bridge deck and roadway information were entered by selecting the Deck/Roadway icon on the left side of the editor. Additionally, the Bridge Modeling Approach icon was selected and the appropriate information provided (These procedures were also applied to develop the other 3 bridges in the river reach).
After all of the geometric data were entered, the geometry file was saved. This was performed from the Geometric Data Editor by selecting File and then Save Geometry Data As. The title was entered as "Existing Geometry" and the OK button was selected.
Steady Flow Data
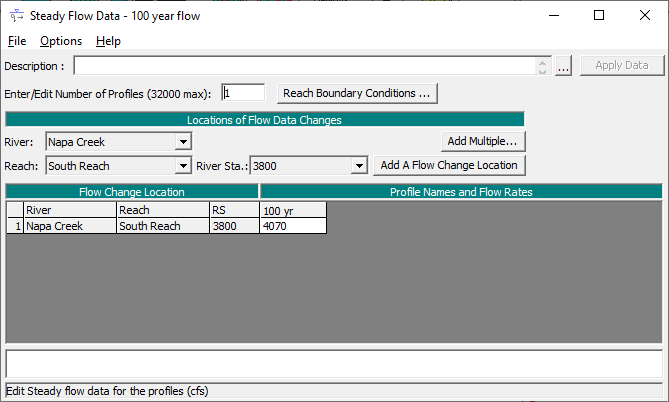
The next step was to develop the steady flow data file. To create this file, from the main program window Edit and then Steady Flow Data were selected. This activated the Steady Flow Data Editor as shown in the figure below. One profile was selected to be analyzed for the reach "South Reach." The flow value of 4070 cfs, representing the one-percent chance flood, was entered at river station 3800 (the upstream river station) and a downstream known water surface elevation of 13 feet was entered by selecting the Boundary Conditions icon. Finally, the steady flow data were saved. To perform this, from the Steady Flow Data Editor, File and then Save Flow Data As were selected. The title "100 year flow" was entered and the OK button was selected. The editor was then closed.
Existing Conditions Plan
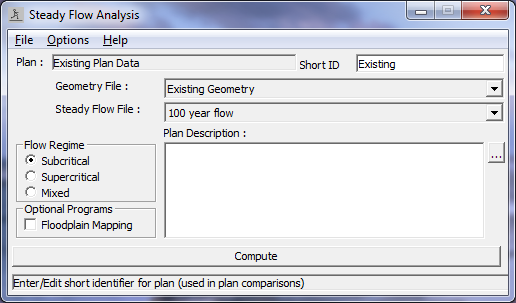
Once the geometric data and steady flow data were entered and saved, a plan that associated these two files was created. To perform this, from the main program window, Run and then Steady Flow Analysis were selected. This activated the Steady Flow Analysis Window as shown in the figure below. Next, a Short ID was entered as "Existing." The geometry file "Existing Geometry" and the steady flow file "100 year flow" were selected by using the down arrows on the right side of the window (Note: At this point, only one geometry and one flow file existed and it was not necessary to use the arrows.). A subcritical analysis was chosen as the Flow Regime and then, File and Save Plan As were selected. The title "Existing Plan Data" was entered and the OK button selected. This created a plan that associated the existing conditions geometry file with the steady flow file. This plan had an extension ".P01" because it was the first plan created.
After the plan was saved, the COMPUTE button was selected to execute the program. During the execution, a run file with the extension ".R01" and an output file with the extension ".O01" were created. The extension number 01 for both the run and output files correspond with the plan with the same extension number.
Existing Conditions Output
The existing conditions output review will be limited to viewing the profile for the river reach. A more detailed analysis will be performed when comparing the existing and proposed model output in a subsequent section. To view the profile plot of the river reach, from the main program window select View and then Water Surface Profiles. This will display the profile as shown in the figure below. The first part of the heading at the top of the profile is the name of the project: "Napa Cr. Bridge Project - Example 7." The second part of the heading is the name of the plan: "Existing Plan Data." Finally, the date that the output file was created also appears in the heading.
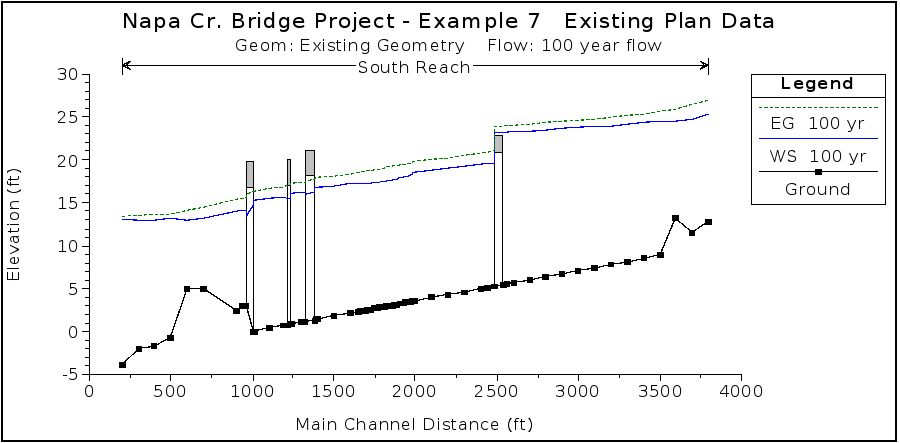
The profile of the existing conditions analysis shows that the upstream bridge at river station 2512 was overtopped during the 100-year flow event. It was proposed that a new bridge be installed to replace the existing bridge. The new bridge would be designed so that the 100-year flow event did not impact the bridge decking. To evaluate this proposed bridge replacement, the existing conditions geometry file was changed and a new plan was created. This procedure is outlined in the following sections.
Proposed Conditions Analysis
For the proposed conditions, the bridge at river station 2512 will be replaced by a new bridge. To perform this, first the geometry file was changed to reflect the proposed conditions. Then, a new plan was created with the new proposed geometry file and the original steady flow file. This procedure is outlined below.
Proposed Conditions Geometric Data
To change the geometry for the bridge at river station 2512, first the geometry file "Existing Geometry" was activated. Then, this geometry file was saved as a new geometry file. This was performed by selecting File and then Save Geometry Data As from the Geometric Data Editor. The title "Proposed Bridge" was entered and the OK button was chosen. This saved the geometry as a new geometry file. Then, all subsequent changes were made to the "Proposed Bridge" geometry file. This enabled the "Existing Geometry" file to remain unchanged.
With the "Proposed Bridge" geometry file, the Geometric Data Editor was activated and the Bridge/Culvert icon was selected. River station 2512 was chosen at the top of the editor and the Deck/Roadway icon was selected. The existing bridge data was deleted and the new information was entered. The new bridge decking was proposed to have a high cord elevation 1 foot higher than the existing bridge deck. This elevation was chosen as an initial estimate for the proposed bridge and can be altered after the output is reviewed.
After the decking was entered, the pier data was entered by selecting the Pier icon from the Bridge/Culvert Data Editor. Two piers were entered at stations 67 and 82. The pier editor was closed and the resulting bridge appeared as shown in the figure below. Finally, the Description was modified to "Seminary St. Bridge - Proposed." The Bridge Modeling Approach Editor was not altered and the Bridge/Culvert Data Editor was closed.
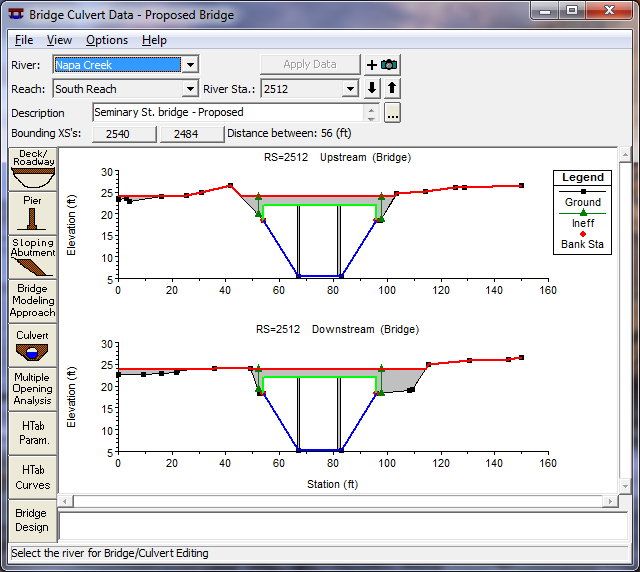
Since the bridge geometry changed at river station 2512, the expansion and contraction reach lengths were adjusted in the vicinity of the bridge. Then, the ineffective flow areas were reestablished at river stations 2484 and 2540. This concluded the changes to the geometric data, and the geometry file was saved by selecting Save Geometry Data from the File menu of the Geometric Data Editor.
Steady Flow Data
The steady flow data for the analysis of the proposed bridge will be the same flow data used with the existing geometry. Therefore, there were no adjustments made to the steady flow data file "100 year flow."
Proposed Conditions Plan
A new plan was created from the geometry file with the proposed bridge and the steady flow data file. To perform this, from the main program window Run and Steady Flow Analysis were selected. A Short ID was entered as "Proposed" in the upper right corner of the window. The geometry file "Proposed Bridge" and the steady flow file "100 year flow" were chosen by selecting the down arrows on the right side of the window. A subcritical analysis was chosen as the Flow Regime. Then, File and Save Plan As were selected. The title "Proposed Plan" was entered and the OK button was selected. This created a plan that associated the proposed conditions geometry file with the steady flow file. This plan had an extension ".P02" because it was the second plan created.
The COMPUTE button was selected to execute the program. During the execution, a run file with the extension ".R02" and an output file with the extension ".O02" were created. The extension number 02 for both the run and output files correspond with the plan number.
Proposed Conditions Output
At this point, the user can activate the water surface profile plot for the proposed conditions, as performed for the existing conditions output. The next section will compare the results of the two plans and the two water surface profiles simultaneously.
Comparison of Existing and Proposed Plans
To compare the output from the two plans, the user can view the results graphically and in tabular format. This comparison will describe the methods to view the output for both plans simultaneously.
Profile Plot
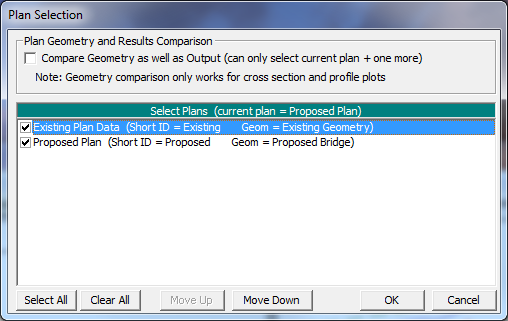
To view the profile plot of both plans, from the main program window select View and then Water Surface Profiles. Then, select Options and Plans. This will activate the pop-up window shown in figure shown below. The plan selection window is divided into two parts: an option for comparing multiple geometries at the top, and a box containing all of the available plans to view output for. To select plans for viewing there output, simple check the box in front of each plan label. Additionally, the Select All and Clear All buttons can be used. For this example, both plans were selected by choosing the Select All button. Then, the OK button was chosen to exit the window. This resulted in the profile as shown in the bottom figure. The option for comparing geometries allows the user to plot the output and geometric data for two plans simultaneously. Since the invert and channel geometry did not change between these two plans, there was no benefit to selecting this option.
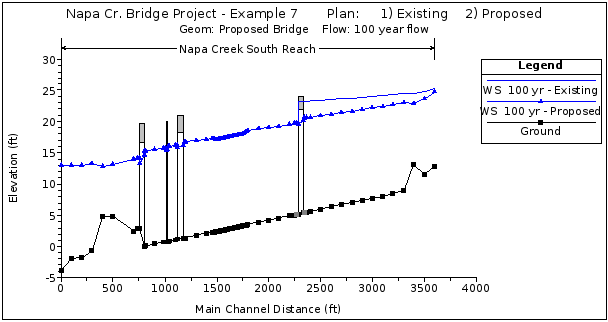
The figure above shows the profile for both plans. The heading displays the information as discussed previously. The legend shows that there are two water surface profiles plotted in the figure. The first profile is labeled "WS 100 yr - Existing" and is a solid line. The label "WS 100 yr" refers to the label of the flow data for the first water surface profile, while the label "Existing" refers to the Plan Short ID that was entered in the Steady Flow Analysis Window. Therefore, this water surface is for the Existing Condition plan. Similarly, the label "WS 100 yr - Proposed" is the 100 yr water surface profile for the "Proposed" plan data.
Since both plans only had one flow entered, only one water-surface profile can be plotted for each plan. If other flow profiles had been computed, then the user could also select to plot those profiles.
It should be noted that since the profiles were plotted from the proposed conditions plan, the geometry that is displayed in the figure above is from the proposed conditions plan. In other words, the bridge at river station 2512 displays the geometry (elevation) of the proposed bridge. If this procedure had been performed from within the existing conditions plan, then the geometry of the profile would exhibit the existing conditions geometry. In either case, the water surface profiles for each plan are plotted as calculated for that plan. Finally, the figure above clearly shows the decrease in the upstream water surface due to the proposed bridge allowing the flow to pass completely under the bridge.
Cross Section Plots
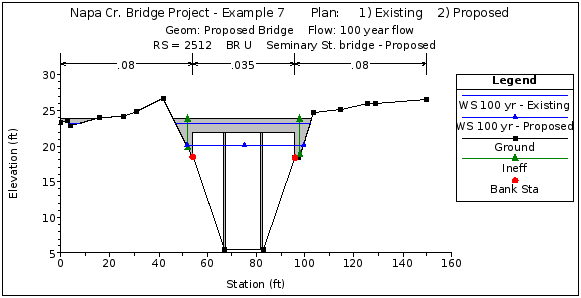
In a similar manner, the water surface for both plans can be viewed on the cross section plots. This is performed by selecting View and then Cross-Sections from the main program window. River station 2512 (upstream inside bridge) was then chosen and this displayed the cross section plot as shown in the figure below. It should be noted that once the option was selected to display the profiles from both of the plans, this option will remain in effect globally until otherwise selected. This allows the user to only activate this feature once, instead of having to set the option for each table and plot that is requested. This option can be returned to the default of only viewing the current plan information when viewing any of the plots or tables.
Additionally, the program will revert back to only displaying the current plan information whenever a new plan or project is opened.
In reference to the preceding figure, the headings and legend are as described previously. The cross section was selected from within the proposed geometry plan and therefore the bridge shown is the proposed bridge. The first water surface is for the existing conditions plan and the second water surface is for the proposed conditions plan.
Standard Table
In addition to graphical displays, the user can compare the output in tabular form. From the main program window, select View and then Profile Summary Table. By selecting Standard Table 1, the table as shown in the figure below will appear. The first two columns of the table display the river reach and river station. The third column identifies which plan the data are from. The identifiers in this column are obtained from the Short ID entered in the Steady Flow Data Editor. The remaining portion of the table displays information for each plan such as total flow, energy gradeline elevation, water surface elevation, etc. By presenting the data in this format, the modeler can easily compare the output for each plan.
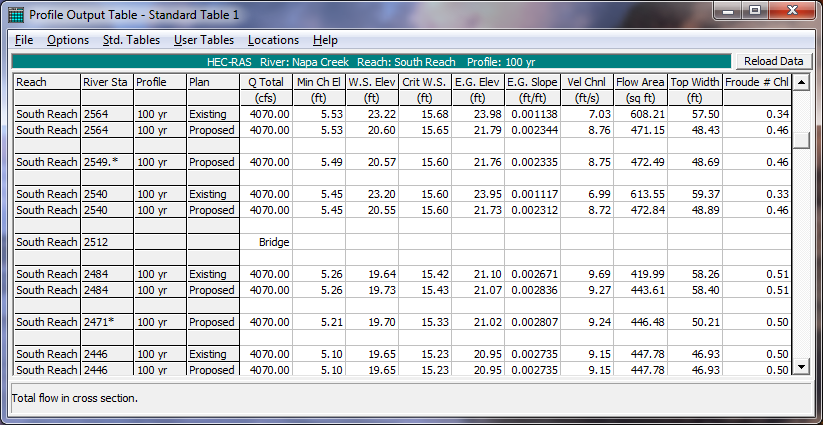
As an additional note, if a river station only appears in one of the plans, then the table will only display the data for that plan. This occurs for river station 2549* and 2471*, which are only used in the proposed geometry plan. These river stations can be viewed by using the down arrows on the right side of the table.
Bridge Only Table
In a similar fashion to the first standard table, the Bridge Only Table was activated from the Std. Tables pull down menu and is shown as Table 7.2. To insert this table into the text, File, and then Copy to Clipboard were selected. Then, the table was pasted into this document and appeared as shown in Table 7.2.
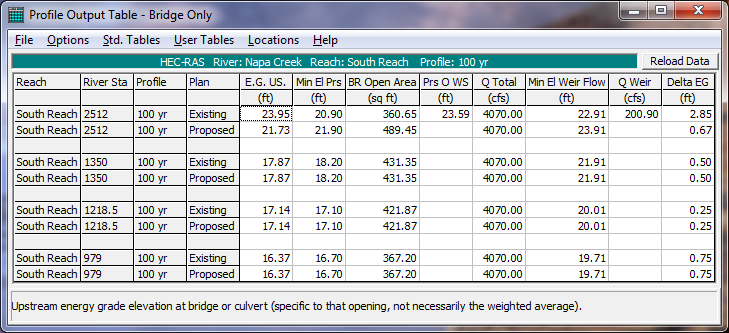
As for the standard table, the river reach and river stations are shown in the first two columns and the Short IDs are used to identify the plans in the third column. This table shows that for the bridge at river station 2512, weir flow occurred for the exiting conditions bridge but did not occur for the proposed bridge geometry plan. The data for the other three bridges in the table are the same for both plans since there was only a change in the geometry at the upstream bridge.
X-Y-Z Perspective Plot
As a final view of the output, a 3D view of the river reach is shown in the figure below. This plot was activated from the main program window by selecting View and then X-Y-Z Perspective Plots. Only a portion of the Napa Creek reach is shown in the figure for clarity. The figure displays the 3D plot from river station 3300 to river station 2200. This was performed by selecting the Start and End down arrows and selecting the appropriate river stations. The modeler can select various azimuth and rotation angles to obtain differing views of the river reach. The river stations on the plot are aligned according to the configuration as drawn on the River System Schematic.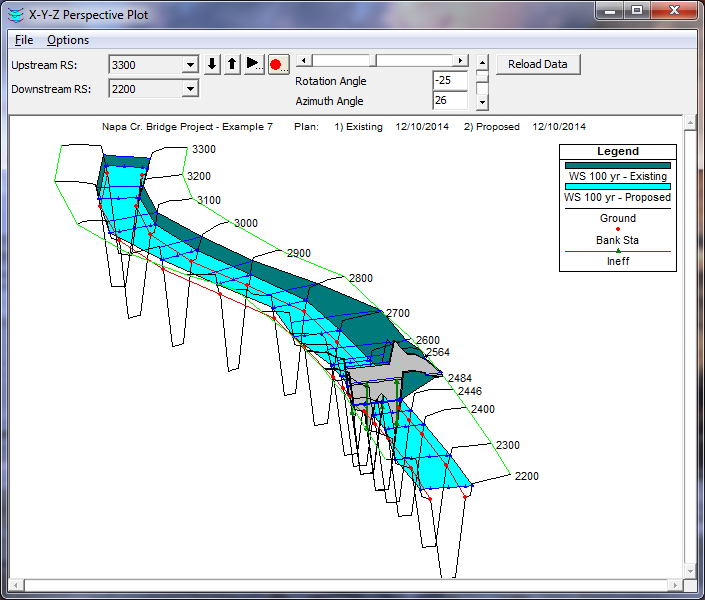
Summary
For Example 7, the concept of multiple plan analysis within a single project was discussed. There are several advantages to using a multiple plan analysis. One of these advantages is the use of a single flow data file for multiple geometry simulations. This reduces the need for identical flow files. Another advantage pertains to the analysis of the output. With multiple plans, the user can select to have the data from any number of plans displayed collectively. This allows for a proficient comparison of the plans.
For this example, the multiple plans were developed by altering the geometry of the river reach. Conversely, a multiple plan analysis could be composed of plans that relate changes of user-selected coefficients such as energy loss coefficients, Manning's n values, and entrance and exit loss coefficients. By understanding the concept of multiple plan analyses, the user can employ a more efficient procedure for analyzing a project.