Download PDF
Download page Overflow Gates - Example 21.
Overflow Gates - Example 21
This example will demonstrate the use of HEC-RAS to analyze a river reach with storage areas that contains a storage area connection, inline weir, and lateral weir that have overflow gates.
To perform the analysis the user must enter the geometric data for the weirs and gated spillways, along with the geometry of the river reach and storage areas. Then, the user must set the gate opening schedule for each gate in the Unsteady Flow Data Editor. The modeler is referred to Chapter 6 of the User's Manual for discussion on entering the geometric data for the weir and gated spillways, Chapter 7 of the User's Manual for entering the gate opening flow data, and Chapter 8 of the Hydraulic Reference Manual for the hydraulic analysis procedures for analyzing the flow through the gate openings and over the weir.
To review the data files for this example, from the main HEC-RAS window, select File and then Open Project. Go to the directory in which you have installed the HEC-RAS example data sets. From the "Applications Guide\Example 21 – Overflow Gates" subdirectory, select the project labeled "Test of Overflow Gates." This will open the project and activate the following files:
Plan: "Open Air Gates – Complex Network"
Geometry:"Complex network with Open Air Gates"
Flow: "Test event – Complex Network"
 Example 21 - Overflow Gates.zip
Geometric Data
To view the geometric data for the river system, from the main program window select Edit and then Geometric Data. This will activate the Geometric Data Editor and display the river system schematic as shown the figure below. The schematic displays the 11 river stations of the reach "Marston Creek" on "Overflow Reach", with river station 1000 as the upstream cross section and zero as the downstream cross section.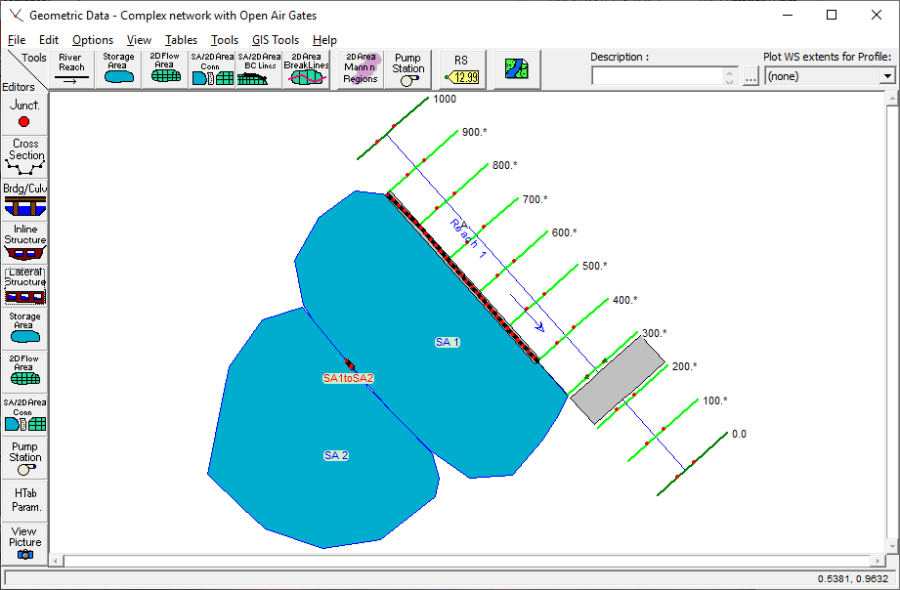
Cross Section Data
The cross section data consists of the X-Y coordinates, Manning's n values, contraction and expansion coefficients, etc. The user can view this data for each river station by selecting the Cross Section icon on the left side of the Geometric Data Editor. For this example, an inline structure was added at river station 250 and a lateral structure connected to a series of storage areas was added at river station 899. These elements will be discussed in the next section. The upstream and downstream cross sections were manually entered while the nine river stations in between were interpolated. For more information on entering cross section data and interpolating cross sections look to "Example 1 Critical Creek" and Chapter 6 of the User's Manual.
Inline Structure
To add an inline structure, the Inline Structure icon was selected from the left side of the Geometric Data Editor. This activated the Inline Structure Data Editor as shown in the figure below. Then, Options and Add an Inline Structure were selected and river station 250 was entered as the location for the weir. The schematic then displayed the cross section data for the river station immediately upstream of the weir location: namely river station 300 for this example. 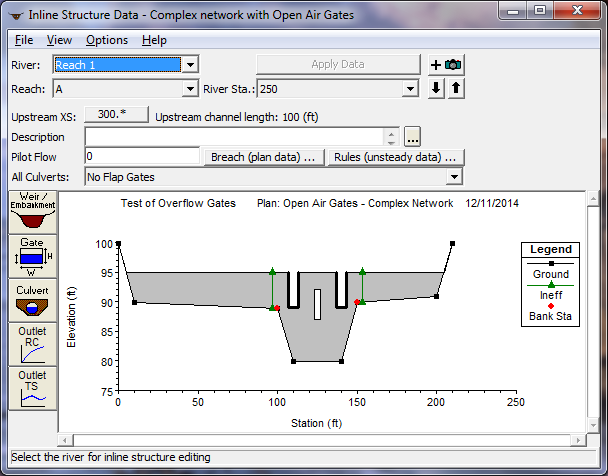
To enter the data for the weir, the Weir/Embankment icon was selected from the left side of the Inline Structure Data Editor. This activated the Inline Structure Station Elevation Data Editor as shown in the figure below. This editor is similar to the deck/roadway editor used for bridges and culverts.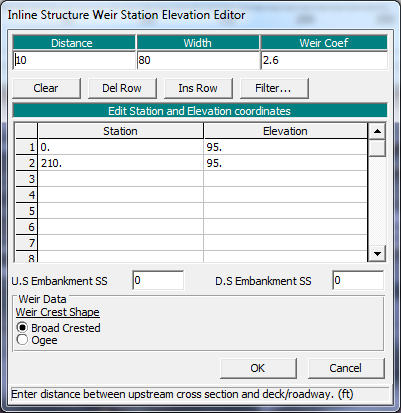
The top row of the editor consists of three data entry fields. For the first field, the user must enter the Distance from the upstream cross section (RS 300) to the upstream side of the weir. For this example, this distance was 10 feet. Next, the Width of the weir was entered as 80 feet. This is a total distance of 90 feet. The distance from river station 300 to 200 is 100 feet. Therefore, the distance from the downstream end of the weir to cross-section 200 is 10 feet. The last field in the top row of the editor is the Weir Coefficient and was entered as 2.6, coinciding with the Broad Crested weir shape chosen at the bottom of the editor. The central portion of the editor consists of a table in which the user must enter the station and elevation data for the weir. The first station of the weir was entered as zero and the last station is at 210 feet – both have an elevation of 95 feet. With these weir stations and elevation, the program will block out the entire area below the weir crest.
Inline Structure Overflow Gates
To enter the data for the gates, the Gate icon was selected from the Inline Structure Data Editor (above). This activated the Gate Editor as shown in the figure below. There are two gate types utilized for this structure: Overflow (open air) and Overflow (closed top). For this example, two open air overflow gates and one closed top overflow gate were entered. The gates were divided into two groups - the open air overflow gates in one group and the closed top gate in the other. A second gate group was created by clicking the New Gate Group icon (looks like a blank sheet of paper and is located at the top of the editor).
For Gate Group #1, the Height, Width, and Invert of the two openings were entered as 6, 6, and 89 feet, respectively. On the lower left side of the editor, the centerline stations for the two gates in group one were entered as 110 and 140. As these values were entered, the counter field # Openings increased to represent the total number of gates for the group (two for this example). The Weir Shape was chosen as "Broad Crested" from the dropdown menu and its coefficient was entered as 2.6. Unlike the closed top overflow gate, the open air overflow gate does not require the user to enter values for sluice gate flow or submerged orifice flow because it only experiences weir flow.
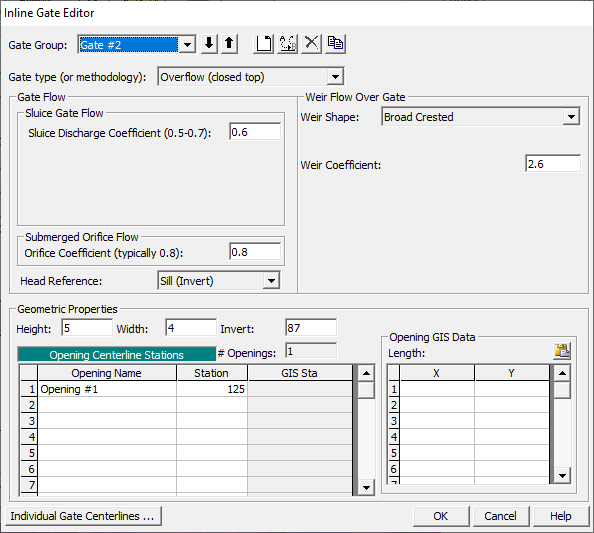
The information for gate group two was entered by first selecting it from the Gate Group dropdown menu in the top left corner of the Inline Gate Editor. The Height, Width, and Invert of the closed top overflow gate (chosen from the Gate type dropdown) were entered as 5, 4, and 87 feet, respectively. The centerline station is 125.
The remaining portion of the editor is divided into two sections, one for the Gate Flow data and one for Weir Flow data. The gate data is used when the water surface upstream of the gate is greater than 1.25 times the gate opening (as measured from the gate invert). At this water surface elevation, the gate is controlling the flow rate. The weir data is the shape of the weir under the gate and is used when the upstream water surface is less than or equal to the gate opening. At this water surface elevation, the weir under the gate is controlling the flow through the gate opening (i.e., the water is not in contact with the gate).
Since the first field - Gate Type - has already been chosen as Overflow (closed top) the fields below it should have already been visible. The Sluice Discharge Coefficient was entered as 0.6. The Orifice Coefficient was kept at its default value of 0.8 for fully submerged flow conditions. Additionally, the head reference for the gate equation defaults to the "Sill (invert)" of the gate opening. This is appropriate for gates that release water to a channel, rather than to the free atmosphere.
For the Weir Flow data, the Weir Shape was selected as "Broad Crested". The weir coefficient was entered as 2.6. The OK button was selected at the bottom of the Gate Editor and the gates appeared on the Inline Structure Data Editor . (Note: The ineffective flow areas will be entered subsequently.) At this point, the user should zoom in on the gate openings to ensure that they do not overlap and appear as intended. The Inline Structure Data Editor was then closed.
Ineffective Flow Areas
As performed for bridges and culverts, ineffective flow areas should be entered on the cross sections that bound the inline structure. For this example, the cross section that is upstream of the structure is 300 and the cross section downstream of the structure is 200. To enter the ineffective flow areas, the Cross Section icon was selected from the Geometric Data Editor (see first figure on this page). Then, river station 300 was selected and Ineffective Flow Areas was selected from the Options menu. This activates the Ineffective Flow Editor as shown below. The distance from the inline structure (river station 250) to river station 300 is 10 feet. The left edge of the gates at river station 300 is station 107. Therefore, the left ineffective flow area was set to begin at 107 - 10 = 97. Similarly, the right ineffective flow area was set at station 153 (= 143 + 10). The elevation of both the left and right ineffective flow areas is 95 feet, which coincides with the top of the weir. The OK button on the editor was selected and similar ineffective flow areas were entered at river station 200.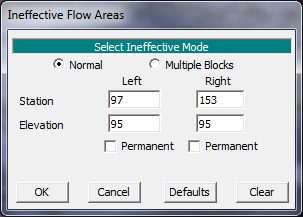
Creating Storage Areas
When creating the storage areas, first the Storage Area icon was selected from the Tools toolbar (not to be confused with the Storage Area icon from the Editors toolbar) of the Geometric Data Editor. The pointer was then placed on the edge of the right overbank of Overflow Reach and the storage area was drawn by single clicking and dragging the mouse for each desired point for the storage area. The final point for the storage area was selected by double clicking the mouse. Upon double clicking the mouse, a dialog box appears requesting a storage area name. The name "SA 1" was entered. Points on a storage area may be added or removed by using the Add Points to a Reach or SA and Remove Points to a Reach or SA options found in the Edit menu. The same steps were taken to create SA 2.
Entering Data for a Storage Area
After the storage area was drawn in the Geometric Data Editor the surface area for storage was entered. The data was entered in the Storage Area Editor, displayed in the figure below, found by selecting the Storage Area icon on the Editors toolbar. For both SA 1 and SA 2 the Area times depth method was selected. An area of 25 acres with a minimum elevation of 90 feet and an area of 10 acres with a minimum elevation of 90 feet was entered for SA 1 and SA 2, respectively. This method computes the product of a constant area and change in water surface elevation to calculate storage volume.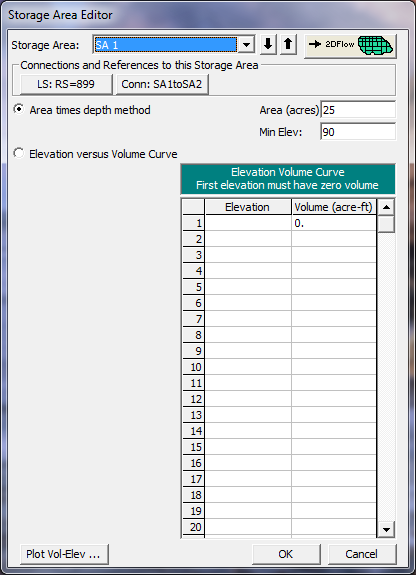
Lateral Structure Connected to a Storage Area
A lateral structure was placed at river station 899 that connected Overflow Reach to SA 1. This was accomplished by selecting the Lateral Structure icon from the Editors toolbar in the Geometric Data Editor. After selecting the icon, the Lateral Structure Data Editor appears, as shown in the figure below. With the reach selected as Overflow Reach, under the Options menu, Add a Lateral Structure was selected. The location of the structure was entered at 899. This placed the beginning of the structure between river stations 900 and 800.
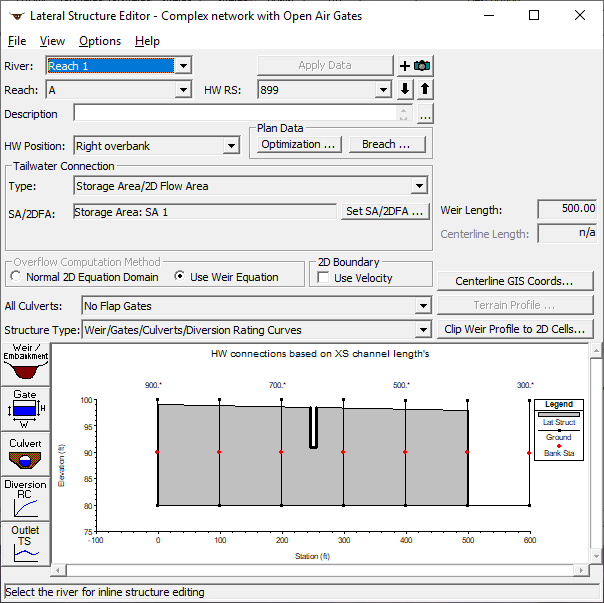
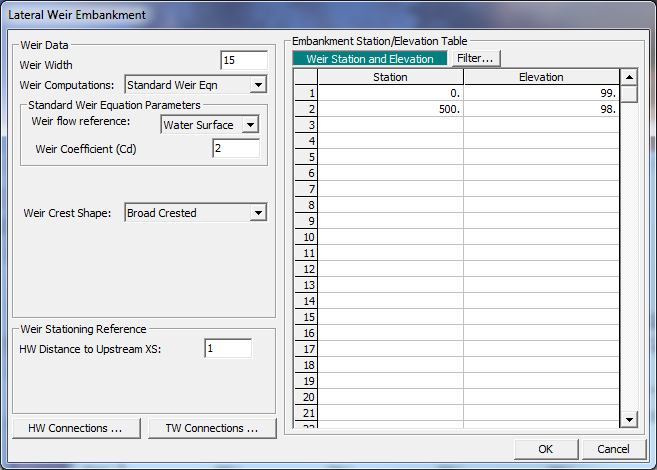
To enter data for the structure, the Weir/Embankment icon was selected from the Lateral Structure Data Editor. The data was entered as shown in the figure below on the Lateral Weir Embankment Window. The 500 foot weir is broad crested with a width of 15 feet, placed one foot from the upstream river station 900. "Water surface" was chosen as the weir flow reference method. Returning to the Lateral Structure Data Editor, the HW Position was selected as "Right overbank" from the pull-down menu and the Tailwater Connection Type was chosen as Storage Area. Lastly, a connection was made to the storage area by selecting the Set SA button. A window then popped up, allowing the user to select a storage area to connect to. On the pull-down menu "Storage area: SA 1" was selected.
Lateral Structure Overflow Gates
To enter the data for the gates, the Gate icon was selected from the Lateral Structure Data Editor. This activated the Gate Editor as shown below. 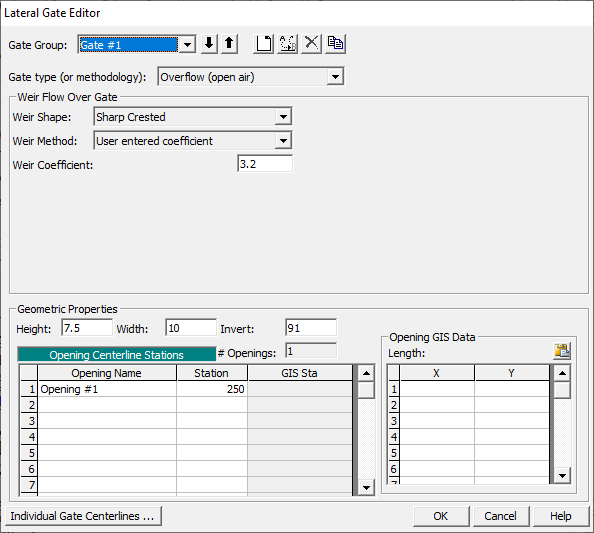
The gate type was selected as "Overflow (open air)". The Height, Width, and Invert of the gate opening were entered as 7.5, 10, and 91 feet, respectively. On the lower left side of the editor, the centerline station for the gate was entered as 250. The Weir Shape was chosen as "Sharp Crested" from the dropdown menu and the "User entered coefficient" was selected as the weir method. The coefficient was entered as 3.2.
Storage Area Connections
Storage area connections are used to connect storage areas to other storage areas. To make a connection from SA 1 to SA 2, the Storage Area Connection icon was selected from the Tools toolbar in the Geometric Data Editor. A line was drawn from SA 1 to SA 2 by right clicking on SA 1 and then double clicking on SA 2. A prompt came up that asked for the name of the connection and the name "SA1toSA2" was given to the storage area connector.
Next, the Storage Area Connection editor (below) was brought up by clicking the icon on the Geometric Data Editor. The storage areas were selected by pressing the Set SA buttons next to the From and To location fields. Storage area: SA 1 was selected as the From location, and Storage area: SA 2 as the To location. The Structure Type was chosen as Weir and Gates from the drop down menu. Next the Weir/Embankment icon was selected. A 100 ft long broad crested weir with a weir coefficient of 2.6 and weir width of 5 feet was entered at an elevation of 97 feet.
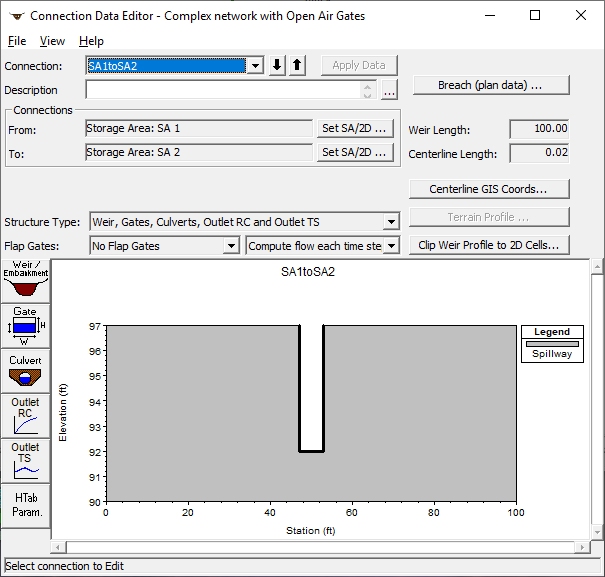
Storage Area Connection Overflow Gate
An opening in the embankment was placed along the centerline of the weir by selecting the Gate icon on the Storage Area Connection Data Editor. This selection displayed the Connection Gate Editor shown on the figure below. An Overflow (open air) gate type was selected that had geometric properties as follows: height of 5 feet; width of 6 feet; invert elevation of 92 feet; and one opening at station 50. At low flows, the gate is modeled as a sharp crested weir with a user defined weir coefficient of 3.2. All entered input can be seen in the figure below. The gate opening schedule was entered as an internal boundary condition in the Unsteady Flow Data Editor and is discussed further in a latter section. 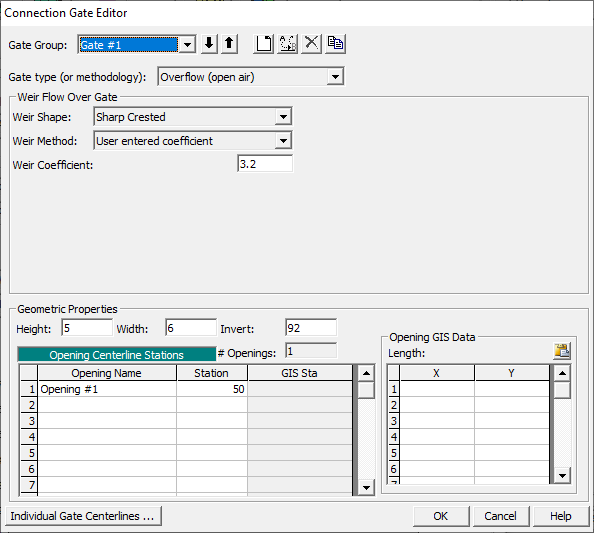
Unsteady Flow Data
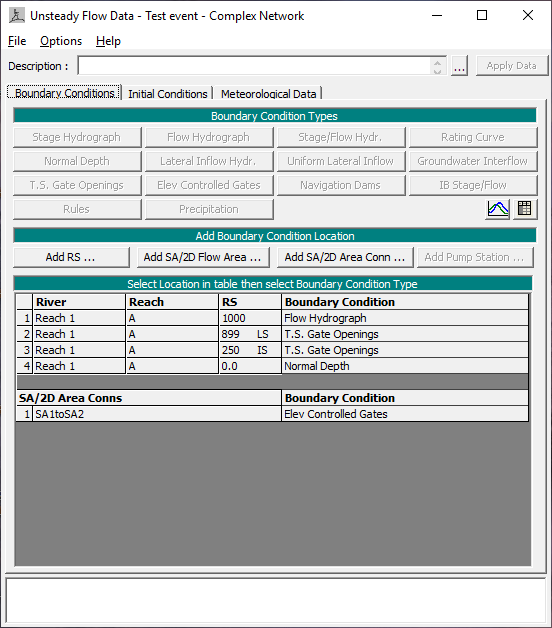
The user is required to enter boundary conditions and initial conditions for the system at the beginning of the simulation period. For additional information on unsteady flow data refer to Chapter 8 of the User's Manual, Performing an Unsteady Flow Analysis. The Unsteady Flow Data Editor, shown below, was selected from the main program window under the Edit menu.
Boundary Conditions
Boundary conditions are required for the farthest upstream and downstream cross sections. Upon entering the Unsteady Flow Data Editor the farthest upstream and downstream cross sections will be located in the boundary conditions column. In this case, the user will see River Station 1000 and River Station 0.0 as the upstream and downstream boundary conditions, respectively. Boundary conditions are set by highlighting the adjacent cell under Boundary Condition Type. When a cell is highlighted, not all boundary conditions are available. The program will automatically gray out all irrelevant boundary condition types. Internal boundary conditions may be added by selecting one of the buttons under the "Add Boundary Condition Location" heading.
Upstream Boundary Condition
For River Station 1000 a flow hydrograph was selected as the boundary condition by highlighting the cell and pressing the Flow Hydrograph button. The window where the Flow Hydrograph is entered is shown in the figure below. The user may select to read hydrograph data from a DSS file or manually enter the data. For further instruction on using a DSS file see Unsteady Flow Application Example 17. For this example the flow hydrograph was manually entered by selecting the Enter Table radio button. The Data Time Interval was set to one hour and the radio button Use Simulation Time was selected causing the initial propagation of the hydrograph to coincide with the beginning of the simulation time window. The hydrograph was then manually entered into the table.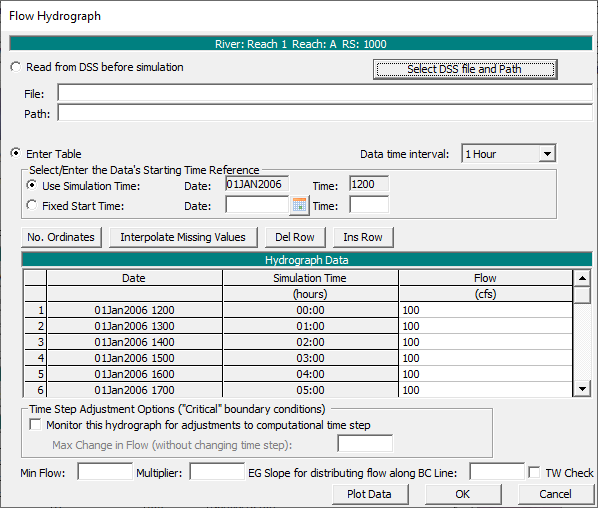
Downstream Boundary Condition
For River Station 0.0 the boundary condition selected was normal depth. Again, the corresponding cell for that particular river station was highlighted and then the Normal Depth button was selected. A friction slope of 0.0002 was entered in the window that appears.
Internal Boundary Conditions
Boundary conditions were entered for the gates of the inline structure, lateral structure, and the storage area connector. The lateral structure (RS 899) and the inline structure (RS 250) both utilized "T.S. Gate Openings" while the storage area connecter used "Elev Controlled Gates." These boundary condition types were selected in the same manner as the upstream and downstream boundary condition types were selected. The time series gate openings for the inline and lateral structures were manually entered separately by selecting the Enter Table radio button on the Gate Opening Editor. The Data Time Interval was set to one hour and the radio button Use Simulation Time was selected causing the initial propagation of the hydrograph to coincide with the beginning of the simulation time window. The gate opening height was then manually entered into the table. Since the inline structure has two gate groups, the process had to be completed for each group. In this example, each gate group has a different gate schedule. 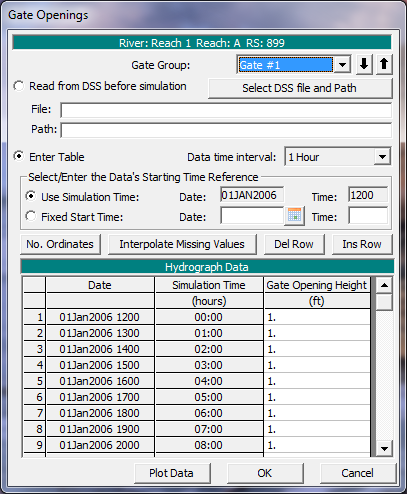
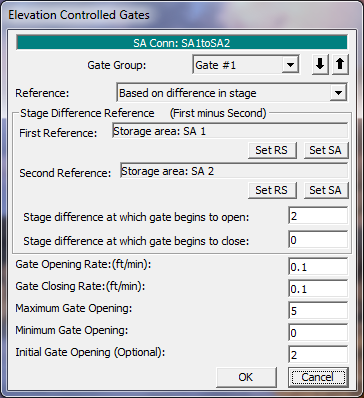
The elevation controlled gate used for the storage area connector was entered in the Elevation Controlled Gates editor (below) that appeared once Elev Controlled Gates was selected as the boundary condition type. The gates operation is "Based on difference in stage," which was chosen from the dropdown of the Reference field. Once selected, the rest of the fields appeared and were filled in as shown below. The First Reference and Second Reference were selected as "Storage area: SA 1" and "Storage area: SA 2," respectively, by clicking the Set SA button under each field and choosing the appropriate storage area from the dropdown. The Stage difference at which gate begins to open/close was set to 2/0. In laymen's terms this says that when the water surface in SA 1 is two feet above that of SA 2 the gate begins to open; when the water surface of the two storage areas are equal, the gate begins to close back.
Initial Conditions
Initial conditions consist of flow information at each of the cross sections, as well as elevations for any storage areas defined in the system. Data for initial conditions is established by selecting the Initial Conditions tab on the Unsteady Flow Data Editor.
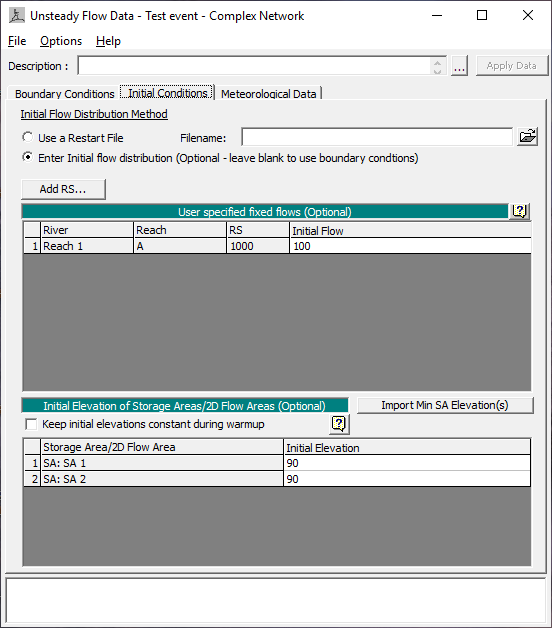
As shown above, the Enter Initial flow distribution radio button was selected and an initial flow of 100 was entered for the most upstream river station (1000). The initial elevation of both storage areas was set to 90 feet. The data was then saved (File -> Save Unsteady Flow Data As) in the Unsteady Flow Data Editor and the window was closed.
Unsteady Flow Analysis
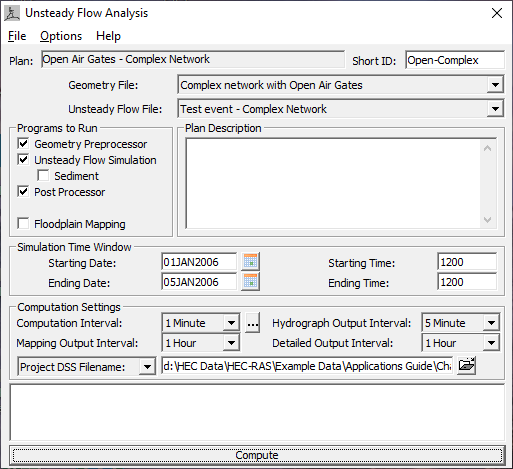
After the geometry and unsteady flow data have been completed an unsteady flow analysis may be initiated. Under the main program window Unsteady Flow Analysis was selected under the Run menu. This will display the Unsteady Flow Analysis Window shown in the figure below. A plan was defined by selecting the Geometry File "Complex network with Open Air Gates" and the Unsteady Flow File "Test event – Complex Network." Under the File menu, Save Plan As was selected and the plan title was entered as "Open Air Gates – Complex Network." After entering the title of the plan a short identifier was entered as "Open-Complex" and the plan was saved. The data was entered as seen the figure below. For more information on the Simulation Time Window, Computation Settings, and Programs to Run refer to "Unsteady Flow Application – Example 17".
Output Analysis
For the analysis of the output, the Water Surface Profiles, the Detailed Output Tables and the Profile Summary Tables for all the gate structures will be reviewed. Each of these is discussed in the following sections.
Water Surface Profiles
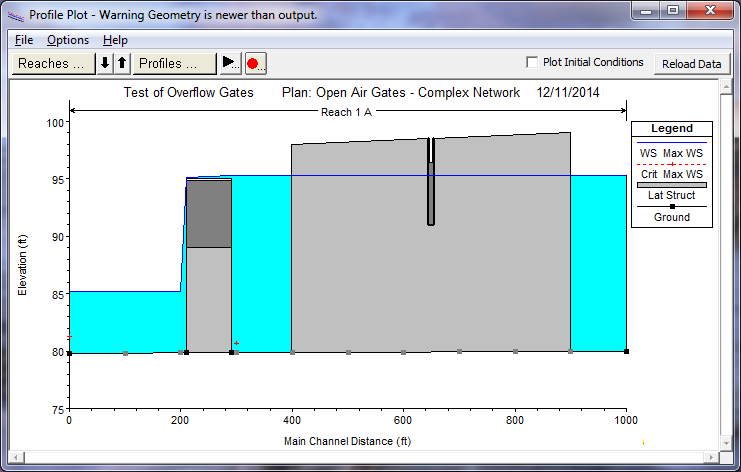
The water surface profiles are shown in the figure below. This figure was activated from the main program window by selecting View and then Water Surface Profiles. The figure shows the maximum water surface profile as well as the gate openings for the lateral weir (RS 899) and the inline weir (RS 250).
Detailed Output Tables
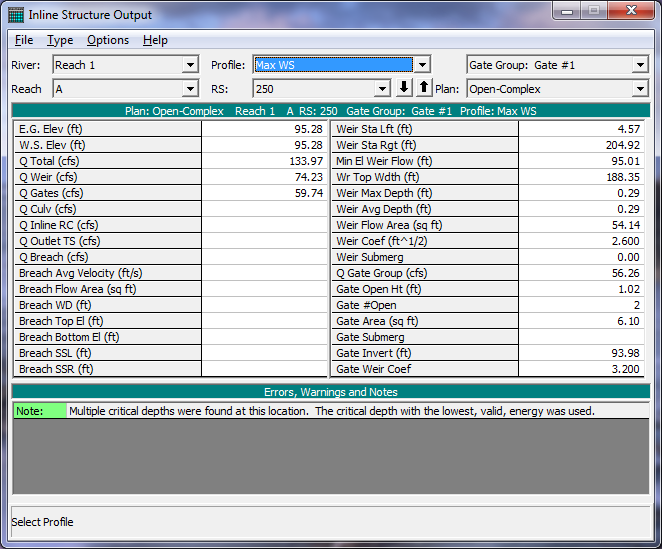
To review the flow parameters through the gate openings, the Inline Structure type Detailed Output Table was activated and is show in the figure below. This table was activated from the main program window by selecting View, Detailed Output Table, Type, and then Inline Structure. The Lateral Structures and Storage Area Connections can also be viewed by selecting them from the Type menu. At the top of the table, "Overflow Reach" was selected as the Reach and the river station was 250 (the cross section for the inline structure). As shown in the figure below, the profile was selected as "Max WS" and the Gate ID was selected as "Gate #1." The details for the inline structure's other gate can be viewed by selecting "Gate #2."
As seen in the right column of the output table, the Gate #1 group has two gates opened 1.02 feet at the time of the maximum water surface. At the maximum water surface profile, gate group #1 passes 56.26 cfs of the total 133.97 cfs flowing through the inline structure. The remainder of the flow passes through Gate #2 (3.48 cfs) and over the weir (74.23 cfs). The overflow gates invert elevation at the time is 93.98 feet (Gate invert + gate height – gate opening = 89 ft + 6 ft – 1.02 ft).
Since the gates in gate group #1 are open air, they are always modeled as weir flow; however, the closed top overflow gate of gate group #2, can also be modeled as submerged orifice or sluice gate flow depending on the headwater and tailwater conditions. At the profile "Max WS" the closed top overflow gate is modeled as sluice gate flow. The user can determine that the gate flow in this example is being modeled as sluice gate flow by:
- Evaluating whether the Gate Area field, which is the flow area in an open gate, is equal to the area of the gate opening (Gate Open Ht * Gate Width). This implies that the gate is flowing at full capacity.
- Checking whether the water surface elevation (95.28 ft) is above the top of the gate (92 ft).
- The tailwater elevation (85.21 ft at RS 200) is well below the invert elevation of the gate (91.98 ft at this particular profile). If the gate reached a submergence of 67% (see Hydraulic Reference Manual, Chapter 8 for how this is calculated) the program would begin to transition to the fully submerged Orifice equation.
Profile Summary Table
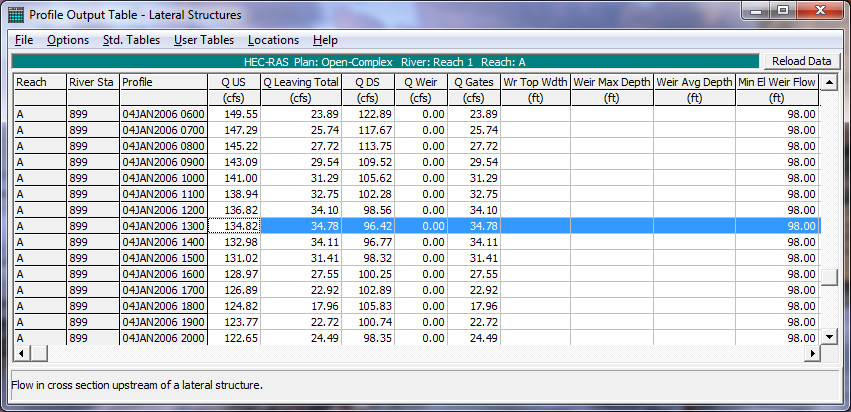
The Profile Summary Table is beneficial when the user wants to evaluate and compare several profiles at once. The Lateral Structure Profile Summary Table is shown in the figure below. This figure was activated from the main program window by selecting View, Profile Table, Std. Tables, and then Lateral Structure. The Inline Structure Profile Table and the Storage Area Profile Table can also be selected in this same manner. However, the storage area connection does not have a profile table (although the net flux out of/into the storage area can be viewed in the Storage Area Profile Table).
The table displays the water surface elevations, energy grade line, and total weir and gate flows for each of the profiles. This table shows that weir flow never occurred during the entire event, but water did pass through the overflow gate. The maximum flow through the gate occurred at January 4th at 1300 hours at a rate of 34.78 cfs.
Summary
This unsteady flow example consisted of a relatively complex system which included a storage area connection (connecting two storage areas), lateral weir, and inline structure – all utilized the overflow gate feature. While all of the gates modeled were overflow gates, one of the inline structure's gates was closed top while the remaining gates were open air. The modeler was instructed on how to setup the gates and where to review the output results.
By reviewing the water surface profiles and the output tables, the user can determine the type of flow through the gate openings and determine if adjustments to the gate settings are required to provide for a selected water surface elevation. The Detailed Output table provides detailed output for each gate group, for any profile. The Profile Summary Output Table provides upstream energy and water surface elevations along with the total weir and gate flow.