Download PDF
Download page Split Flow Junction with Lateral Weir/Spillway - Example 15.
Split Flow Junction with Lateral Weir/Spillway - Example 15
This example demonstrates the use of HEC-RAS to optimize two different split flow problems: a lateral weir with gated spillway and a looped network. In both situations, the program uses an iterative procedure to compute the flows and energies at a given point (either the lateral weir or the upstream junction of the looped network).
To perform the analysis, the user must enter the geometric data for the lateral weir and gates, along with the geometry of the river reach system. Then, the user must enter the opening height of each gate group for each flow profile in the Steady Flow Editor. Finally, the user should set the split flow optimization flag (to perform the iterative procedure) for the lateral weir and for the junction at the upstream end of the looped network. The modeler is referred to Chapter 6 of the User's Manual for discussion on entering the geometric data for the weir and gated spillways and junctions and multiple reaches, Chapter 7 of the User's Manual for entering the gate opening flow data, and Chapter 8 of the Hydraulic Reference Manual for the hydraulic analysis procedures for analyzing the flow through the gate openings and over the weir.
To review the data files for this example, from the main HEC-RAS window, select File and then Open Project. Go to the directory in which you have installed the HEC-RAS example data sets. From the "Applications Guide\Example 15 – Split Flow Junction with Lateral Weir" subdirectory, select the project labeled "Split Flow Junction with Lateral Weir - Example 15." This will open the project and activate the following files:
Plan: "Split Flow"
Geometry: "Lateral Weir with Full Looped Network"
Flow: "3 Flow Profiles"
 Example 15 - Split Flow Junction with Lateral Weir.zip
Geometric Data
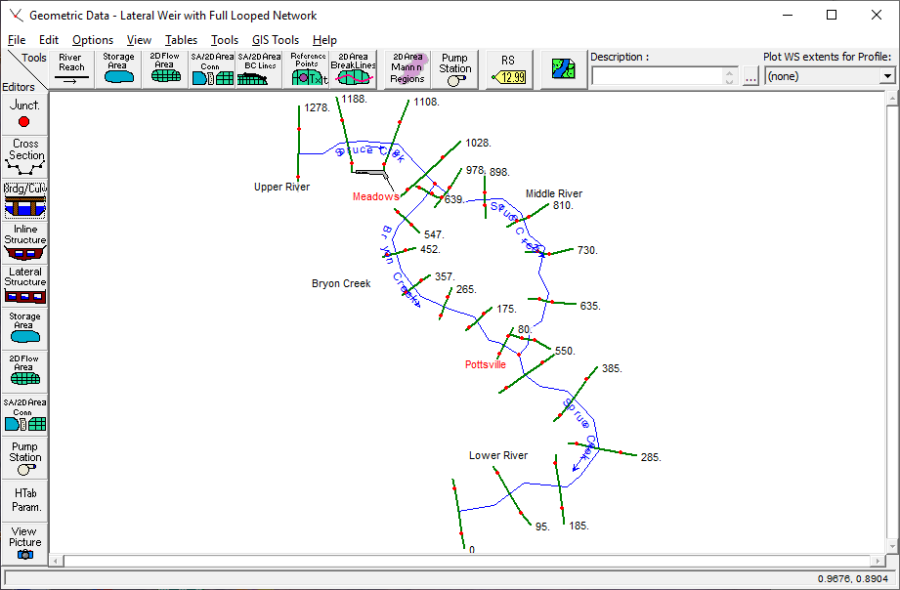
To view the geometric data for the river system, from the main program window select Edit and then Geometric Data. This will activate the Geometric Data Editor and display the river system schematic as shown in the figure below. The schematic displays the 24 river stations of the rivers "Spruce Creek" and "Bryon Creek," with river station 1278 as the upstream cross section and 0 as the downstream cross section.
Stream Junction Data
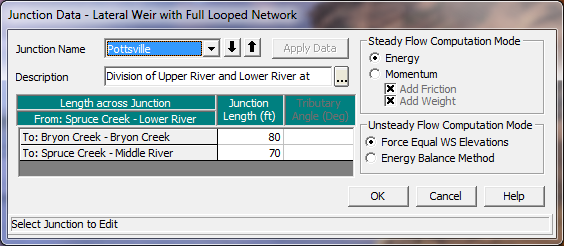
There are four different river reaches in the river system schematic. Spruce Creek is divided into three different reaches: Upper River, Middle River, and Lower River. Bryon Creek is the fourth reach. Bryon Creek and Middle River, together form a closed loop between the Meadows river junction and the Pottsville river junction. The junction editor for the Meadows river junction is shown in the figure below. Meadows is the upstream junction. This is where the flow splits into the two different rivers. This will be discussed in more detail later.
Cross Section Data
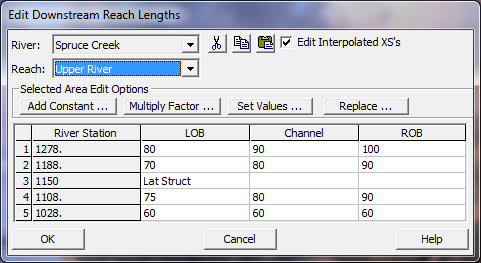
The cross section data consists of the X-Y coordinates, Manning's n values, contraction and expansion coefficients, etc. The user can view this data for each river station by selecting the Cross Section icon on the left side of the Geometric Data Editor. For this example, a lateral weir was added at river station 1150 and will be discussed in the next section. The following figure displays the reach lengths in the vicinity of the weir and was activated by selecting Tables and then Reach Lengths from the Geometric Data Editor.
Lateral Structure
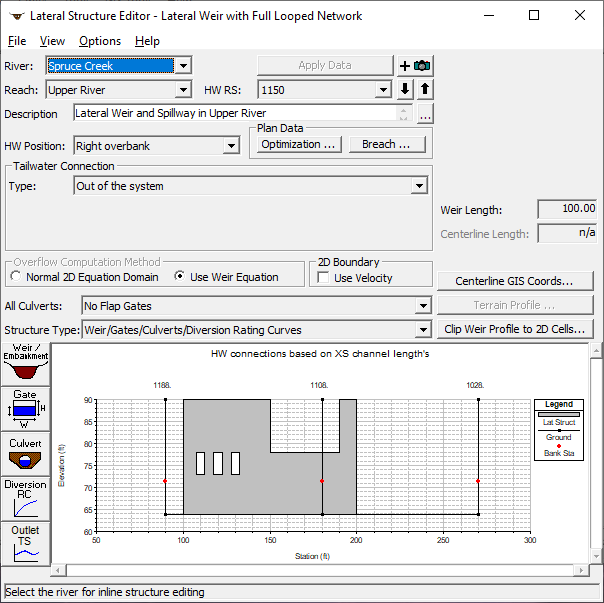
To add a lateral weir and gated spillways, the Lateral Structure icon was selected from the left side of the Geometric Data Editor. This activated the Lateral Structure Editor as shown in the figure below. First, the river "Spruce Creek" and the reach "Upper River" were selected. Then, Add a Lateral Structure was selected from the Options menu, and river station 1150 was entered as the location for the weir. By entering the river station, the upstream end of the lateral weir is automatically placed between the cross section with the next highest river station upstream and the next lowest river station downstream. The schematic will display a profile plot of the lateral weir and any gates. When the lateral weir is first added, the schematic will be blank because the data have not yet been entered. For this example, a description of the weir was entered as "Lateral Weir and Spillway in Upper River." Underneath the description box, is the Position box. By clicking on the down arrow, the modeler can choose to place the lateral weir in the right or left overbank, or the right or left side of the channel. For this problem, the weir has been placed in the right overbank.
To enter the data for the weir, the Weir/Embankment icon was selected from the left side of the Lateral Weir Data Editor. This activated the Lateral Weir/Embankment Editor as shown in the figure below. This editor is somewhat similar to the deck/roadway editor used for bridges and culverts.
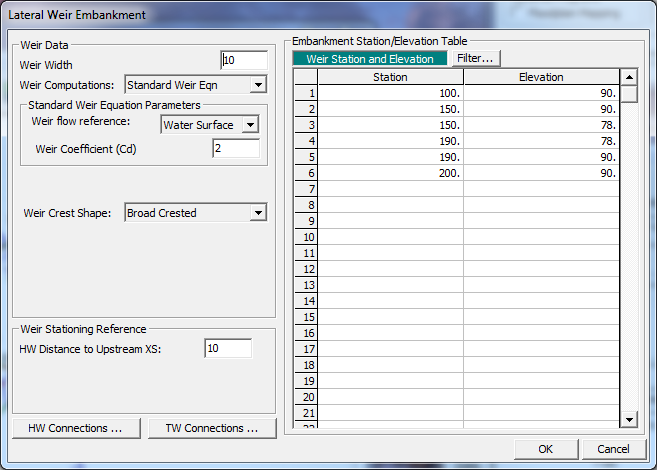
The right hand side of the editor has two columns for the station and elevation data. These data points define the top of the lateral weir and they are entered in the upstream to the downstream direction. Similar to cross section data, the stationing for the data can be based on any horizontal datum. In this example, the weir starts at an elevation of 90 feet at an arbitrary horizontal station of 100 feet. Fifty feet downstream, the weir drops to an elevation of 78 feet. After forty feet, it returns to an elevation of 90 feet at station 190. The weir continues at an elevation of 90 feet until the final station of 200.
The left side of the editor has several fields. The first field is the Weir Width. This is width of the weir in the direction of flow over the weir (perpendicular to the flow in the river cross section). It is not used for hydraulic computations, but is used by the GUI for graphical purposes. In this example, it has been set to 10 feet.
The next field is labeled Weir Computations. This field allows the user to select from two different equations to be used in computing the lateral weir flow: the Standard Weir Equation, and Hager's Lateral Weir equation.
The next lower field is Weir Flow Reference. By left clicking on the down arrow, the modeler can toggle between "Energy Grade" and "Water Surface." Based on this switch, the program will compute the flow over the weir (and through any gates), using either the energy grade or the water surface when calculating the head (i.e. the depth of flow) on the weir. In this example, since the lateral weir is located in the overbank, the energy method was selected.
The next field is the Weir Coefficient (Cd). It is a coefficient that is used in the computation of weir flow. It has been entered as 3.0.
The next field is Weir Crest Shape, and the user can select one of the following four shapes: Broad Crested; Ogee; sharp crested; or zero height weir. For this example, broad crested has been selected. If the Ogee had been selected, two additional fields and a Cd button would have popped up allowing the user to enter a Spillway Approach Height and a Design Energy Head. For the Ogee weir, the user can either enter a weir coefficient or have the program compute a weir coefficient by clicking on the Cd button.
The last field labeled HW Distance to Upstream XS, is used to locate the lateral structure along the stream spatially. The upstream cross section is the first normal cross section immediately upstream of the lateral weir based on river stationing. (Between two normal river cross sections, there can be one or more lateral weirs.) In this example, the upstream cross section is 1188 and the upstream end of the lateral weir is 10 feet from this cross section. So the HW Distance has been entered as 10 feet. The program will compute the distances to downstream cross sections based on where the lateral weir is located. In this example, the HW Position of the lateral weir has been specified as the right overbank (see above). This means that the program will use the right overbank reach lengths. The right overbank length (between cross sections 1188 and 1108) is 90 feet. Therefore, the lateral weir intersects the downstream cross section (river station 1108) twenty feet from the downstream end of the lateral weir.
It should be noted that the lateral weir cannot cross more than 498 cross sections. If this happens, the user should break the lateral weir into two or more weirs that are physically adjacent.
Gated Spillway
To enter the data for the gates, the Gate icon was selected from the Lateral Structure Data Editor (second most previous figure). This activated the Gate Editor as shown in the figure below. For this example, 3 sluice gates were entered. The three gates are always to be opened (or closed) the same amount, so they were defined as a single gate group for ease of operation. If the gates were to be opened or closed individually, then each gate would be defined separately. This will be discussed further when the opening heights are set in the steady flow data editor.
After the Gate Editor is activated, the gate data can be entered. The Height, Width, and Invert for the gates were entered as 5, 5, and 73 feet, respectively. On the left side of the editor, the centerline stations for the three gates were entered as shown in the figure below. As these values were entered, the counter field # Openings increased to represent the total number of gates (3 for this example). By default, the first, and in this example the only, gate group is labeled as "Gate #1." This label could have been changed by clicking on the Rename button.
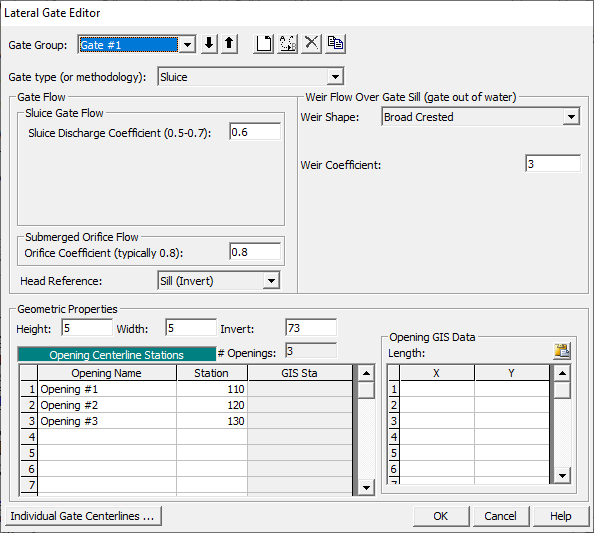
The remaining portion of the editor is divided into two sections, one for the gate flow data and one for weir flow data. The gate flow data are used when the water surface upstream of the gate is greater than 1.25 times the gate opening (as measured from the gate invert). At this water surface elevation, the gate is in contact with the water and is controlling the flow rate. The weir data are used when the upstream water surface is less than or equal to the gate opening. At this water surface elevation, the weir under the gate is controlling the flow through the gate opening (i.e., the water is not in contact with the gate). In between these two elevations, the flow is in a transition zone.
For the gate flow data, the first field is the Gate Type. By selecting the down arrow, the type "Sluice" was chosen. When the gate type was selected, the Trunnion Exponent, Opening Exponent, and Head Exponent values were automatically set to 0.0, 1.0, 0.5 respectively. Since a sluice gate has been selected, the Trunnion Height field is not visible. The Discharge Coefficient was entered as 0.6. This coefficient is used when the gate is experiencing sluice flow (downstream end of the gate is not submerged). The orifice coefficient of 0.8 was entered for full flow conditions (this is used when the tailwater elevation on the gate causes it to be submerged).
For the weir flow data, the Shape was selected as "Broad Crested." The weir coefficient was left as 3. This information appears in the weir data area at the bottom of the Gate Editor.
This completed the data entry for the gates. The OK button was selected at the bottom of the Gate Editor and the gates appeared on the Lateral Structure Data Editor as shown in the third most recent figure. At this point, the user should zoom in on the gate openings to ensure that they do not overlap and appear as intended. The Lateral Structure Data Editor was then closed.
Steady Flow Data
The flow data consisted of three components: the flow rates for each profile; the boundary conditions; and the gate elevation settings. Each of these components are described in the following sections.
Flow Profiles
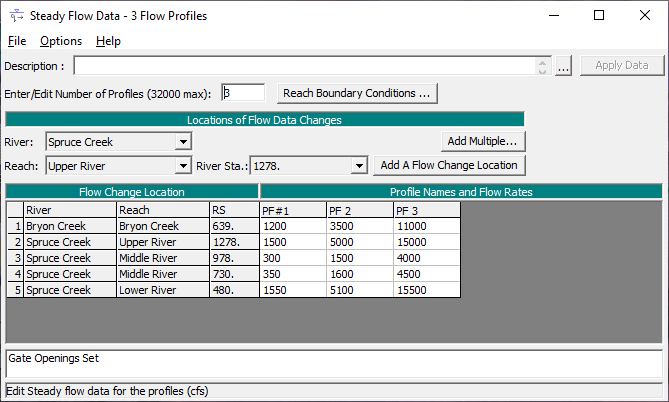
To enter the flow data, the Steady Flow Data Editor (as shown in the figure below) was activated from the main program window by selecting Edit and then Steady Flow Data. For this example, the number of flow profiles was selected as 3. When this number was entered, the table in the central portion of the editor expanded to provide three columns for data entry, one for each profile. The table initially created four rows, one for each of the four river reaches (Bryon, Upper, Middle, and Lower Spruce). For each reach, the upstream most cross section is listed under RS (the river station). An initial flow must be given at the upstream end of each reach. An additional flow change was added to the Middle Spruce reach to model a tributary that enters this reach at station 730. (Since the water surfaces and energies in this tributary are not needed, the tributary was not included in the river schematic.) The flow change was added by clicking the appropriate down arrow to select the River "Spruce Creek," Reach "Middle River," and River Station "730."
As shown in the figure below, the flow at the upstream most cross section (RS 1278 in Upper River) is 1500 cfs for the first profile. This 1500 cfs splits at the Meadows junction into reach Middle River and Bryon Creek. The upstream end of Bryon Creek has 1200 cfs. The upstream end of Middle River has the remaining 300 cfs. The program will use the 1200 cfs and the 300 cfs as the initial guess for the flow split at the Meadows junction. For profile 1 at river station 730 (in Middle River) the flow is listed as 350 cfs.
This means that a tributary flow of 50 cfs enters at this point. Even though the final flow in the Middle river will be different after the flow optimization, the program will maintain the 50 cfs addition at this point. This will be discussed more fully under the Output Analysis section below. Finally, the flow for the top of the Lower River has been entered as 1550. This represents the 1200 cfs coming from Bryon Creek and the 350 cfs (after the tributary) coming from Middle River.
Boundary Conditions
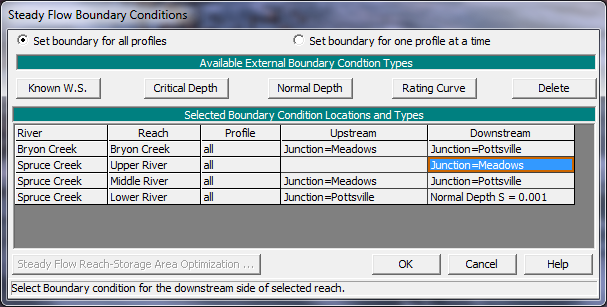
After the flow data were entered, the boundary conditions were entered by selecting the Boundary Conditions button at the top of the Steady Flow Data Editor. This activated the Boundary Conditions Editor as shown in the figure below. For this example, a subcritical analysis was performed. Therefore, an external boundary condition was only needed at the downstream most cross section in reach Lower River. The field under Downstream was selected and then Normal Depth was chosen. A value of S = .001 was entered. Since the Set boundary for all profiles has been clicked, the normal slope of 0.001 will be used for all three profiles. The upstream field of Upper River is blank, since this is a subcritical only analysis. All the remaining fields represent internal connections between different reaches and do not require any additional input from the user.
Gate Openings
The final data entry for the analysis was the gate opening heights. To enter this data, from the Steady Flow Data Editor, select Options and then Gate Openings. This activated the Spillway Gate Openings Editor as shown in the figure below.
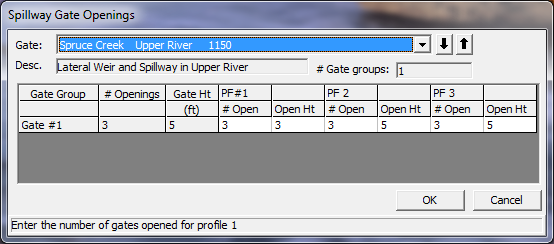
At the top portion of the editor, the River "Spruce Creek," Reach "Upper River" and the River Station "1150" were selected. The Description is the same as was entered in the Lateral Spillway Data Editor (shown on previous page). The # Gate Groups field shows that there is only 1 gate group at this river station. The table in the central portion of the editor has a single row for the one and only gate group. The first column lists the description for the gate group, as it was named in the Gate Editor. The second column displays the number of gate openings for the gate group (3). The third column displays the maximum gate height for the gate group (5 feet for this example).
The remaining portion of the editor consists of entry fields for the number of gates opened and the opening heights of the gates for each flow profile. For the Lateral weir, all of the gates in a gate group must be operated together. For this example, for profile 1, the three gates were opened 3 feet. To close the gates, the user could set the number of gates opened to zero, or, alternately, the gate height could have been set to zero. However, if the user enters a non-zero (i.e. positive) number for the number of gates and the gate height, then the program will open all of the gates in the gate group to that height (the field for the number of gates is set up for the Inline weir where it is possible to only open part of the gates in a gate group). This means that if one gate is opened four feet, then all of the gates will be opened four feet. If the user wanted to only open one gate, then that gate would have to be defined as a separate gate group. A Lateral Weir can have a maximum of ten gate groups. So ten gates (or groups of gates) could be operated independently. If more than ten gate groups are needed, the lateral weir could be defined as two or more parts. For instance, a thousand foot long lateral weir could be defined as two 500 foot long lateral weirs. Each "weir" would have to be entered separately with its own river station and data. By choosing the appropriate Distance to upstream cross section, the two weirs could be placed immediately adjacent to each other. This would allow for twenty different gate groups to be operated independently.
The user can toggle across the table to view the number of gates open and the gate opening heights for all of the profiles. During the analysis of the output, the various gate settings will be discussed. This concludes the data entry for this example. At this point, the OK button at the bottom of the editor was selected and the flow data was saved as "3 Flow Profiles."
Steady Flow Analysis
After all of the geometric and flow data had been entered, the Steady Flow Analysis Window was activated from the main program window by selecting Run and then Steady Flow Analysis. It is shown in the figure below (top).
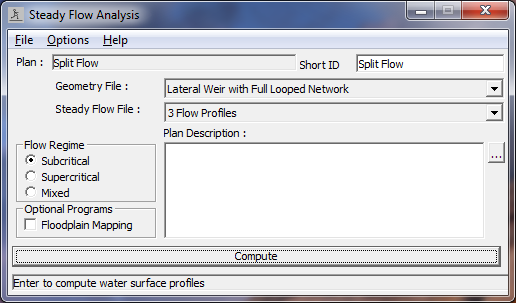
First, the Short ID was entered as "Split Flow." Next, the flow optimization flags were turned on. This was done by selecting Options and then Split Flow Optimizations. This activated the Split Flow Optimization Editor as shown in the figure below (bottom). The tab for the lateral weir was selected by clicking on it. After clicking on it, the user can toggle between turning optimization on or off by checking the box under the "optimize" column. If the optimization flag had been left off, the program would still calculate the flow over the lateral weir. However, this flow would not be removed from the river system (this will be discussed more later).
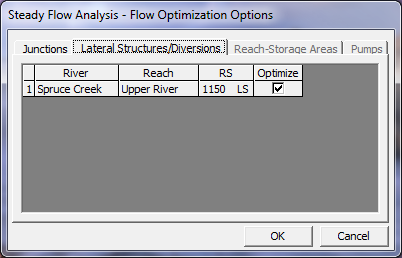
Next, optimization for the junction was turned on. This was done by clicking on the Junction tab, which changes the Optimization Editor as shown in the figure below. Optimization at the Meadows junction can then be toggled like it was for the lateral weir. Flow optimization can only be performed at junctions that have more than one downstream reach. For this reason, the Editor does not display the Pottsville junction. If the optimization flag at the Meadows junction had been left off, the program would not optimize the flow split. Rather, the program would maintain the same flow ratio in each reach.
For instance, assume that for the first profile, the junction optimization is off and that the upstream lateral weir has an outflow of 500 cfs. This means that there would be 1,000 cfs flowing into the Meadows junction instead of 1,500 cfs. The program would then proportionately reduce the flow in each reach. Middle River would be 200 cfs (instead of 300 cfs) and Bryon Creek would be 800 cfs (instead of 1,200 cfs).
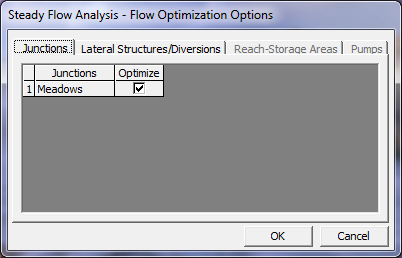
Now that the optimization flags have been turned on, the files for this plan can be named and saved. First, the geometry file was selected as "Lateral Weir with Full Looped Network" and the flow file was "3 Flow Profiles." Next, the Flow Regime was selected as "Subcritical." Then, File and Save Plan As were chosen and the information was saved as the plan "Split Flow." This plan name then appeared on the Steady Flow Analysis Window, as well as on the main program window. Finally, the COMPUTE button was clicked to perform the analysis.
Output Analysis
For the analysis of the output, the water surface profiles, the lateral weir type cross-section table, the lateral weir only type profile table, the junctions table, and the standard profile table will be reviewed. Each of these is described in the following sections.
Water Surface Profiles
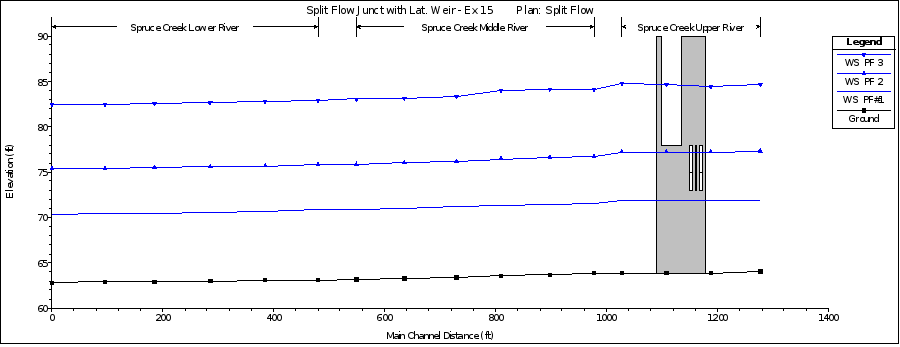
The water surface profiles are shown in the figure below. This figure was activated from the main program window by selecting View and then Water Surface Profiles. The figure shows all three of the flow profiles. It shows all three of the reaches that make up Spruce Creek, but it does not show the Bryon Creek reach. As can be seen from the figure, the lateral weir has no flow for the first profile, flow through just the gates for the second profile, and flow through the gates and over the weir for the third profile.
Lateral Structure Detailed Output Table
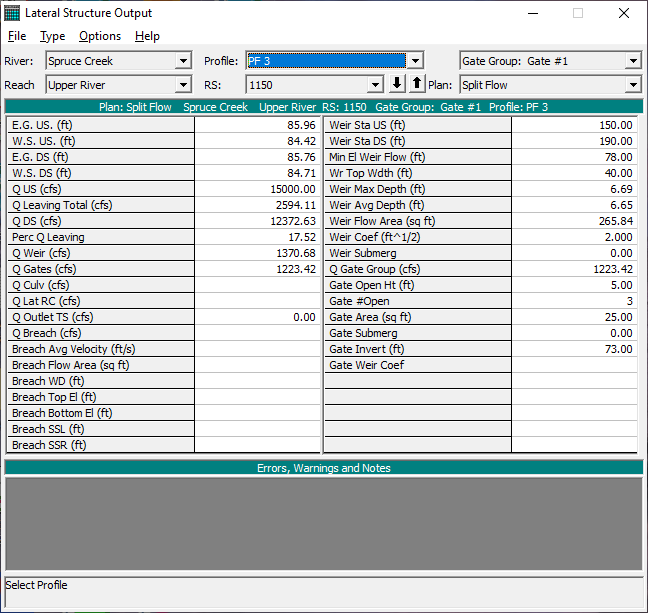
To review the detailed hydraulic results for the lateral structure the Lateral Structure type Detailed Output Table was activated and is show in the figure below. This table was activated from the main program window by selecting View, Detailed Output Table, Type, and then Lateral Structure. At the top of the table, River was selected as Spruce Creek, the Reach was selected as "Upper River" and the river station was 1150 (the node for the lateral weir). The profile was selected as "3."
The table shows the energy grade and water surface at the upstream and the downstream end of the weir. For this profile, the energy grade at the start of the lateral structure is 85.96 feet and 85.76 feet at the downstream end. The total flow upstream of the lateral structure is 15000 cfs. The total flow in the river downstream of the lateral structure is 12372.6 cfs (the lateral structure is spilling 2594.1 cfs or 17.3% of the flow). The program shows that the flow over the top of the weir is 1370.7 cfs and through the gates is 1223.4 cfs for a total of 2594.1 cfs.
In order to perform the backwater computations (and get the water surfaces and energies in the vicinity of the weir), the program must know the amount of flow in the river. To do this, it assumes the amount of flow that will be diverted by the lateral weir. This is based on the previous iteration (for this example, for the final iteration, a flow of 2612 cfs was assumed to be diverted). After the backwater calculations have been performed, the program can compute a flow for the lateral weir based on water surfaces and energies (in this case, 2594 cfs). If these two numbers are within the default tolerance of 2% (2% of the assumed 2612 cfs or 52 cfs), then the lateral weir is assumed to have converged. The default tolerances can be changed from the Steady Flow Editor by choosing Options and then selecting Set Calculation Tolerances (this editor is not shown).
Lateral Structure Profile Summary Table
The Lateral Structure Only Profile Summary Table is shown in the figure below. This figure was activated from the main program window by selecting View, Profile Summary Table, Std. Tables, and then Lateral Structure. The figure displays the water surface elevations, energy grade line, and total weir and gate flows for each of the profiles. This table shows that gate flow occurred for the last two profiles and weir flow occurred only for the last profile. It can be used to assist in the determination of the gate settings to adjust the amount of weir flow and gate flow.

Junctions Profile Summary Table
The Junctions Only Profile Table is shown in the figure below. This figure was activated from the main program window by selecting View, Profile Summary Table, Std. Tables, and then Junctions. The figure displays the water surface elevations, energy grade lines, and total flows for each river cross-section immediately bounding the junction. This table makes it easy to check if the split flow at the junction converged. (For a given profile, the energy grade lines for the cross sections just downstream of the junction should be approximately the same. The default tolerance for junctions is 0.02 feet). It also makes it easy to see how much flow is going into each reach.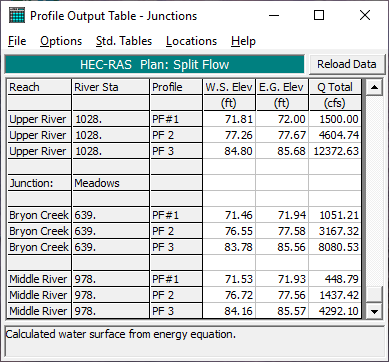
Standard Profile Summary Table
The Standard Table 1 is shown in the figure below. This figure was activated from the main program window by selecting View, Profile Summary Table, Std. Tables, and then Standard Table 1. For this table, only the third profile is being displayed. The flow at river station 1188, upstream of the lateral structure, is 15000 cfs. The flows at river stations 1108 and 1028 are 12745 cfs and 12396 cfs. This represents the flow diverted by the lateral structure. River station 1108 intersects the middle of the lateral weir. So for the third profile, part of the flow is diverted between river stations 1188 and 1108 and the rest is diverted between 1108 and 1028. Note also the 500 cfs increase in flow between river station 810 and 730 (from 4302 cfs to 4802 cfs) in the Middle River reach. This represents the 500 cfs inflow tributary (the tributary is not shown on the river schematic). In the Steady Flow Editor, the flow at river station 730 was entered as 4500 cfs for the third profile. However, due to the flow diversion from the lateral structure and the flow split at the Meadows junction, the flow in the Middle River is not constant. In this situation, the program will keep track of the relative flow change. The 4500 cfs at river station 730 is 500 cfs greater than the 4000 cfs flow at the start of the Middle River reach. Hence, the program adds 500 cfs flow at this river location.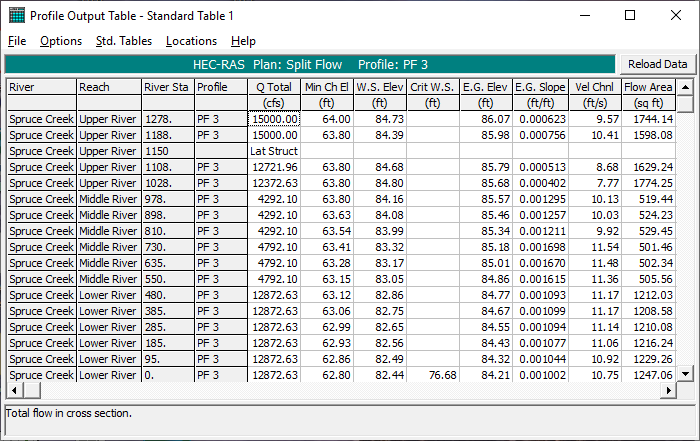
Additional Adjustments
Now that the data have been entered and the program has been run, adjustments can be made to the initial flow split assumptions. Making adjustments can reduce the number of iterations that the program requires and hence speed up the computer run. This will usually be true even if other modifications are being made to the geometry file (e.g. a bridge is being added to one of the river reaches). In some cases, a data set that is not converging can be modified to one that will converge.
Junction Flow Split
The junction profile table shows the flow split at the Meadows junction. For the third profile, Middle River has 4292 cfs and Bryon Creek has 8081 cfs. The 4292 cfs is around 35% of the total flow at the Meadows junction. However, the original data, in the Steady Flow Editor, shows that Middle River has 4000, which is around 25% of the original 15000 cfs flow at Meadows (Bryon Creek has the remaining 11000 cfs). Adjusting this flow to be closer to 35% of the total will speed up the convergence process. In this case a value of 5000 cfs for Middle River and 10000 cfs for Bryon Creek would improve the run time (and increase the chances of successful convergence). Note that it would be incorrect to simply enter the 4292 cfs for Middle River and 8081 cfs for Bryon Creek in the Steady Flow Editor. If this were done, then the program would assume that a flow loss was taking place at the Meadows junction. Note also that if the flow in the Middle River is changed to 5000, then the flow at 730 should be changed to 5500 to maintain the 500 cfs increment.
Lateral Structure Flow Split
The user can also enter a first guess for the amount of flow that will be diverted by the lateral structure. As in the case of a junction, this can improve the run performance. To enter this data, from the Steady Flow Data Editor, Options and then Initial Split Flow Optimization were selected. This activated the Initial Lateral Flow Splits Editor as shown in the figure below. By clicking under the Initial Flow field for the appropriate profile, a first guess for the lateral weir flow can be entered. The program will then assume that this much flow is diverted when it performs the first iteration of the backwater calculations.

Summary
This example computed 3 flow profiles for the Bryon Creek and Spruce Rivers. It included a lateral weir with gates and a fully looped river network between the Meadows and Pottsville junction.
By reviewing the lateral weir and junction tables and the water surface profiles and tables, the user can determine the amount of flow being diverted by the lateral weir and the amount of flow being split into the two reaches downstream of the Meadows junction. The Lateral Weir/Spillway Output table provides detailed output for the lateral weir, for a given profile.
The Junctions table provides flow split output for one or more profiles. The user can also adjust the initial starting conditions to improve the run performance of the computer computations.