Download PDF
Download page Unsteady Flow Application - Example 17.
Unsteady Flow Application - Example 17
This example demonstrates the use of HEC-RAS to perform an unsteady flow analysis on a network of reaches containing junctions, storage areas, bridges, culverts, and hydraulic connections. The geometric data constructed for this example illustrates multiple unsteady flow applications in HEC-RAS. The geometric data used in this example is not a specific reference to any existing stream network.
This example focuses on modeling and evaluating storage areas, hydraulic connections, and hydraulic parameters in an unsteady flow environment. The user is referred to previous examples for discussion on modeling bridges, culverts, multiple reaches, and junctions.
To review the data files for this example, from the main HEC-RAS window, select File and then Open Project. Go to the directory in which you have installed the HEC-RAS example data sets. From the "Applications Guide\Example 17 – Unsteady Flow Application" subdirectory, select the project labeled "Unsteady Flow Application." This will open the project and activate the following files:
Plan: "Diamond River Base Plan"
Geometry: "Diamond River Base Geometry"
Unsteady Flow:"Unsteady Flow"
 Example 17 - Unsteady Flow Application.zip
Geometric Data
To view the geometric data for the river system, from the main program window select Edit and then Geometric Data. This will activate the Geometric Data Editor and display the river system schematic as shown in the figure below.
General Description
The Geometric Data consists of a network of channels connected by junctions. Four storage areas are included in the geometry (Pyramid Lake, Eagle Lake, Upper Angora, and Lower Angora). Pyramid Lake is connected by two reaches (East and West) and by Eagle Lake, via a culvert and a weir. Eagle Lake is hydraulically connected to River Station 1.9 on the Southeast Reach and to the previously mentioned Pyramid Lake. Upper Angora is connected to the Southwest Reach via a lateral weir located between cross sections 1.99 and 1.9. Lower Angora is hydraulically connected to Upper Angora via a culvert and a weir.
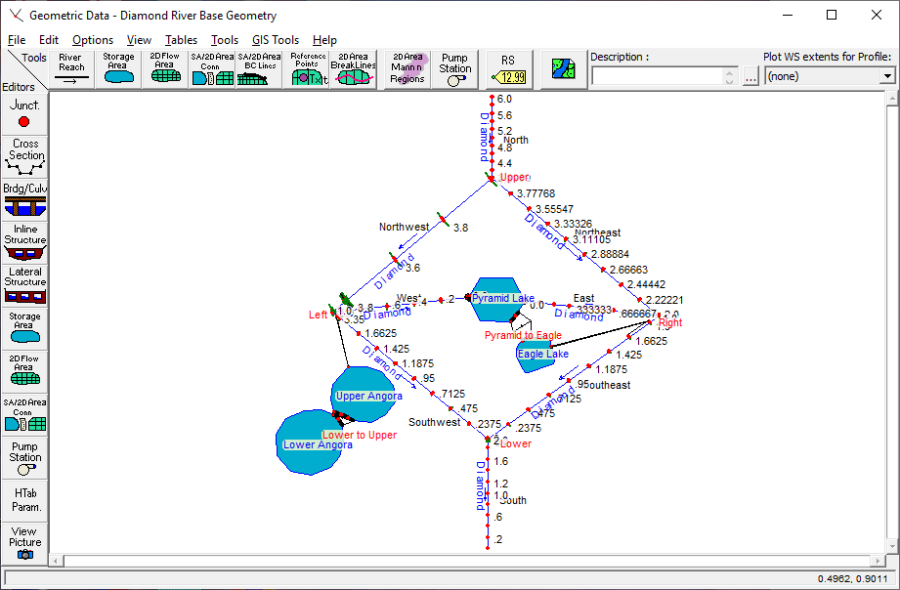
In addition to these features, a culvert is located at River Station 3.395 on the Northwest Reach and a bridge is located at River Station 1.895 on the South Reach. The cross section geometry is prismatic with little change in elevation with distance except for the North Reach. The level topography provides an excellent environment to examine unsteady flow for such aspects as flow reversal.
This example assumes that the user has sufficient experience constructing the following river system features and all attributes associated with each feature.
- Reaches
- Cross Section Geometry
- Junctions
- Bridges and Culverts
Consult with previous examples for information pertaining to the above mentioned features. The following description commences with the creation of storage areas.
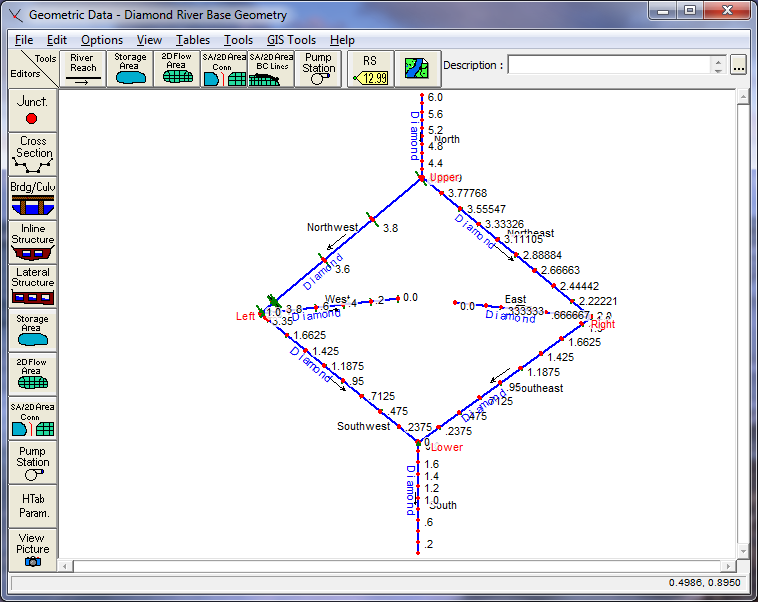
Creating Storage Areas
In the Geometric Data Editor, the starting geometry for this example is shown in the figure above. On the Tools toolbar in the Geometric Data Editor the icon for Storage area was selected. The pointer was then placed between the East and West reaches and the storage area was drawn by single clicking and dragging the mouse for each desired point for the storage area. The final point for the storage area was selected by double clicking the mouse. Upon double clicking the mouse, a dialog box appears requesting a storage area name. The name "Pyramid Lake" was entered. Points on a storage area may be added or removed by using the Add Points to a Reach or SA and Remove Points to a Reach or SA options found in the Edit menu.
It is important that the program recognizes the connection of Pyramid Lake to the East and West reaches. The connection may be made in two different ways. The first option is to draw the storage area so the end of each reach is included within the storage area polygon. The second option is to drag and drop the end of each reach within the storage area polygon by using the Move Object tool found in the Edit menu of the Geometric Data Editor. In both cases the reach and storage area are connected if a black dot appears at the intersection of the reach and the side of the storage area.
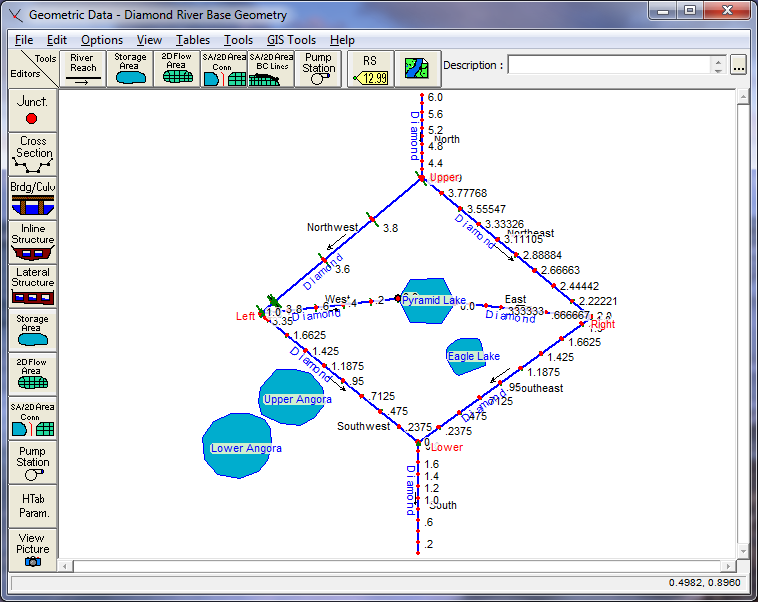
The remaining three storage areas were created in the same manner as Pyramid Lake without any connections to reaches. The figure below displays the completed storage areas in the Geometric Data Editor before the addition of the hydraulic connections. The hydraulic connections for each storage area are discussed in impending sections.
Entering Data for a Storage Area
After the storage area was drawn in the Geometric Data Editor the surface area for storage was entered. The data was entered in the Storage Area Editor, displayed in the figure below, found by selecting the Storage area icon on the Editors toolbar. For Pyramid Lake the Area times depth method was selected. An area of 1000 acres with a minimum elevation of 0 feet was entered. This method computes the product of a constant area and change in water surface elevation to calculate storage volume.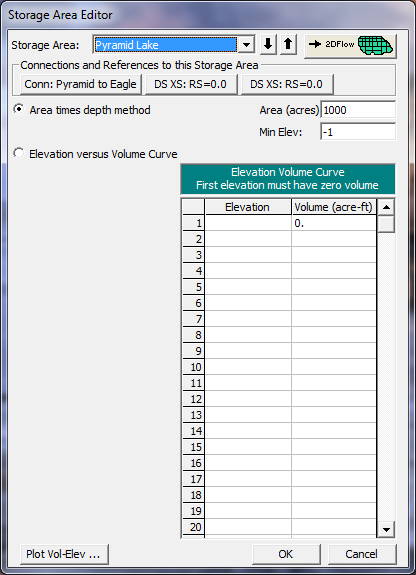
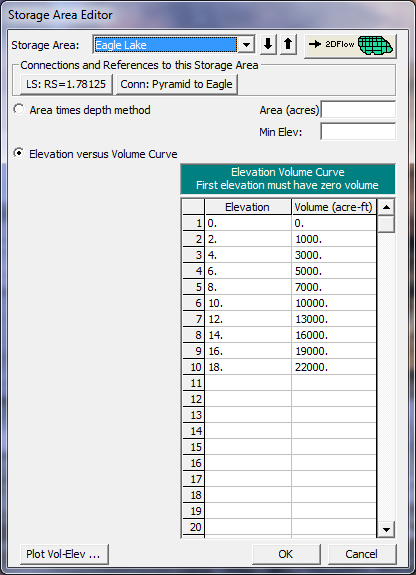
An additional option for calculating storage volume is the Elevation versus volume curve method, shown in the figure below for Eagle Lake. For this method the initial elevation was entered as 0 feet with a volume of 0 acre-feet. Data was then entered in increments of 2 feet for the cumulative volume of storage produced at each increment. It is important to note that the user is not entering the surface area of storage at each increment but the cumulative volume of storage at each increment.
Lateral Structure Connected to a Storage Area
A lateral structure was placed on the Southwest Reach by selecting the Lateral Structure icon from the Editors toolbar in the Geometric Data Editor. After selecting the icon, the Lateral Structure Data Editor appears, as shown in the figure below. With the reach selected as Southwest, under the Options menu, Add a Lateral Structure was selected. The location of the structure was entered at 1.95. This placed the beginning of the structure between river stations 1.99 and 1.9.
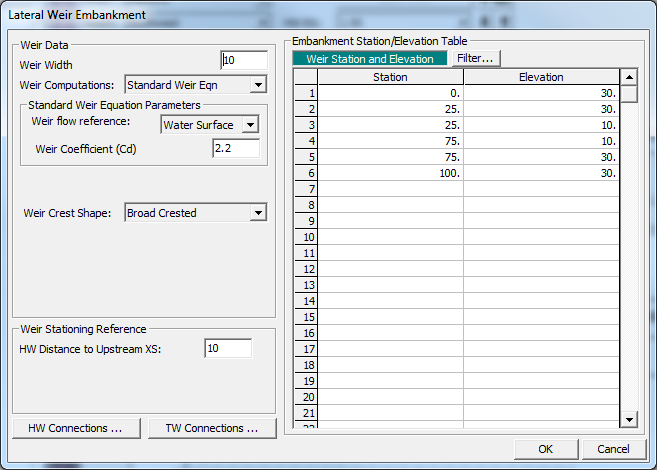
To enter data for the structure, the Weir/Embankment icon was selected from the Lateral Structure Data Editor. The data was entered as shown in the figure below the following figure on the Lateral Weir Embankment Window. The weir is broad crested with a width of 10 feet, placed 10 feet from the upstream river station 1.99. The weir flow reference method was chosen as "water surface."
Returning to the Lateral Structure Data Editor, the "right overbank" was selected from the pull-down position menu. Lastly, a connection was made to the storage area by selecting the Set SA button. A window will then popup, allowing the user to select a storage area to connect to. On the pull-down menu "Upper Angora" was selected.
Another lateral structure was added from the southeast reach to the Eagle lake storage area. This lateral structure was added in the same manner as the previous one, except it had a culvert in addition to the overflow weir.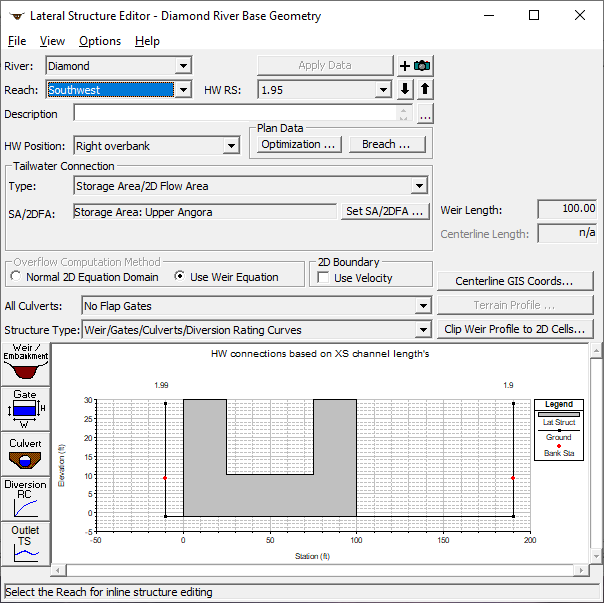
Storage Area Connections
Storage area connections are used to connect storage areas to other storage areas. To make a connection from Pyramid Lake to Eagle Lake, the SA/2D Area Conn icon was selected from the Editors toolbar in the Geometric Data Editor. This brought up the SA/2D Connection Data editor shown in the figure below. The storage areas were selected by pressing the Set SA/2D buttons next to the From and To location fields. Pyramid Lake was selected as the From location, and Eagle lake as the To location. Next the Weir/Embankment icon was selected. A 500 ft long broad crested weir was entered at an elevation of 16.5 feet.
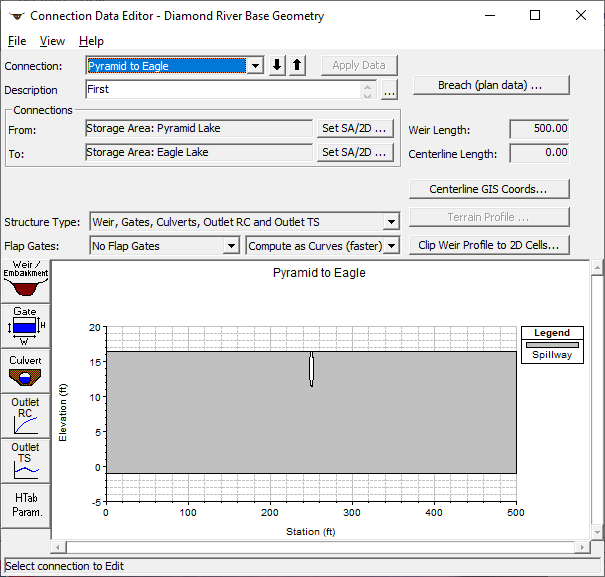
An opening in the embankment was placed along the centerline of the weir by selecting the Culvert icon on the Storage Area Connection Data Editor. This selection displayed the Culvert Data Editor shown on the figure below. A circular culvert with a diameter of 5 feet and an invert elevation of 11.5 feet was entered for this hydraulic connection. Additional parameters entered are shown in the figure below.
One additional storage area connection (Upper to Lower lake) was constructed in the same manner to connect those two storage areas. 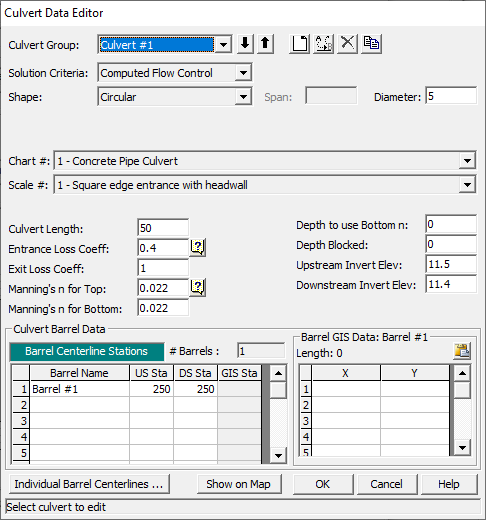
Parameters for Hydraulic Tables
Hydraulic structures, such as bridges and culverts, are converted into families of rating curves that describe the structure as a function of tailwater, flow, and headwater. The user can set parameters to define the curves by selecting HTab Parameters from the Bridge and Culvert Editor or from the Storage Area Connection Editor. For this example, the culverts in storage area connections, the culvert located on the Northwest Reach, and the bridge located on the South Reach may have their parameters adjusted.
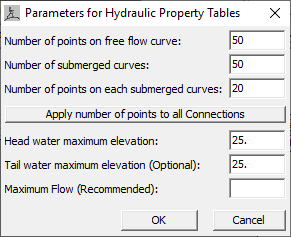
For the bridge located on the South Reach the Bridge/Culvert icon on the Editor toolbar in the Geometric Data Editor was selected. In the Bridge Culvert Data the South Reach was selected and the HTab Param icon was depressed bringing up the Parameters for Hydraulic Properties Tables shown in the figure below. Default values were used for the number of points on a free flow curve, the number of submerged curves, and the number of points on each submerged curve. Limits on the extent of the curves were defined by setting the maximum headwater and tailwater elevations at 26 feet. For additional information on HTAB Parameters refer to Chapter 8 of the User's Manual, Performing an Unsteady Flow Analysis.
Cross Section Table Parameters
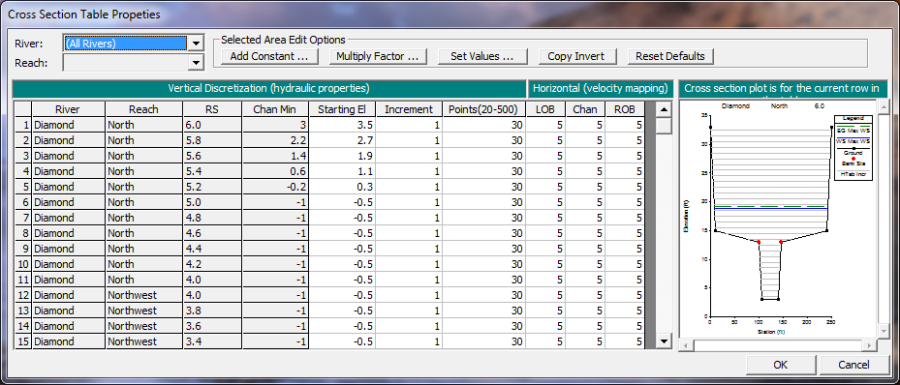
In HEC-RAS, cross sections are processed into tables of elevation versus hydraulic properties of areas, conveyances, and storage. The user is required to set an interval for spacing the points in the cross-section tables. In the Geometric Data Editor the icon Htab Parameters was selected under the Editors toolbar. This displays the Cross Section Table Parameters Window shown in the figure below. The starting elevation, table increment, and number of points columns are automatically filled by the program but may be changed by the user. The program automatically starts the table for each cross section 1 foot above the channel invert. The program chooses a table increment and number of points by first attempting to use 20 points, and choosing an increment that will put the table up to the top of the cross section. If this results in too large of an increment (greater than 1.0 foot) the program will use a one foot increment and add additional points to get the table to the top of the cross section. The increment for this example was set to 1 for "All Reaches" by highlighting the increment column and selecting the Set Values button. The user can set individual values for each cross section if it is deemed necessary. Warning: Always ensure that your cross section tables encompass the complete range of stages that will be modeled. If the tables do not go up to a high enough elevation, the program will have to extrapolate during the computations. More often than not, the extrapolation causes instabilities in the results. To visualize the extent of the tables, a graphic of individual cross sections is shown on the right hand side of the window. The graphic displays the cross section corresponding to the row in which you cursor lies in the table.
Unsteady Flow Data
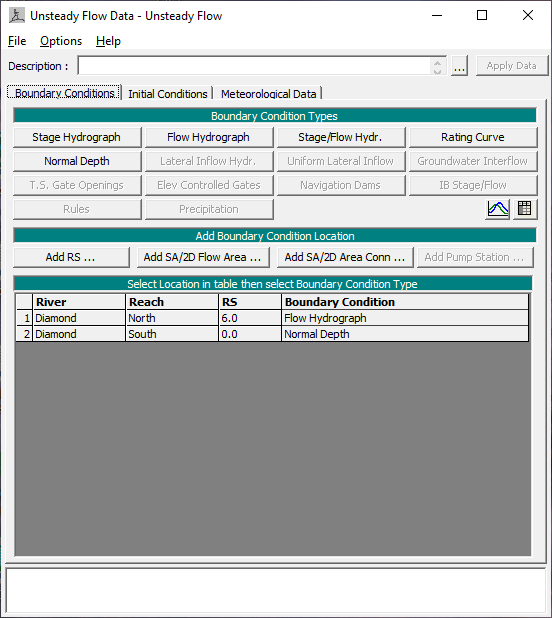
The user is required to enter boundary conditions and initial conditions for the system at the beginning of the simulation period. For additional information on unsteady flow data refer to Chapter 8 of the User's Manual, Performing an Unsteady Flow Analysis. The Unsteady Flow Data Editor, shown in the figure below, was selected from the main program window under the Edit menu.
Boundary Conditions
Boundary conditions are required for the farthest upstream and downstream cross sections. Upon entering the Unsteady Flow Data Editor the farthest upstream and downstream cross sections will be located in the boundary conditions column. In this case, the user will see River Station 6.0 on the North Reach and River Station 0.0 on the South Reach. Boundary conditions are set by highlighting the adjacent cell under Boundary Condition Type. When a cell is highlighted, not all boundary conditions are available. The program will automatically gray out all irrelevant boundary condition types. Internal boundary conditions may be added by selecting one of the buttons under the "Add Boundary Condition Location" heading.
Upstream Boundary Condition
For River Station 6.0 a flow hydrograph was selected by highlighting the cell and pressing the Flow Hydrograph button. The window for a Flow Hydrograph is shown in the figure below. For this example the flow hydrograph was manually entered by selecting the Enter Table radio button. The Data Time Interval was set to three hours and the radio button Use Simulation Time was selected. The Use Simulation Time option starts the hydrograph at the beginning of the simulation time window, which is discussed in an upcoming section. The hydrograph was then manually entered with a baseflow of 100 cfs and a floodwave that peaked at 5000 cfs.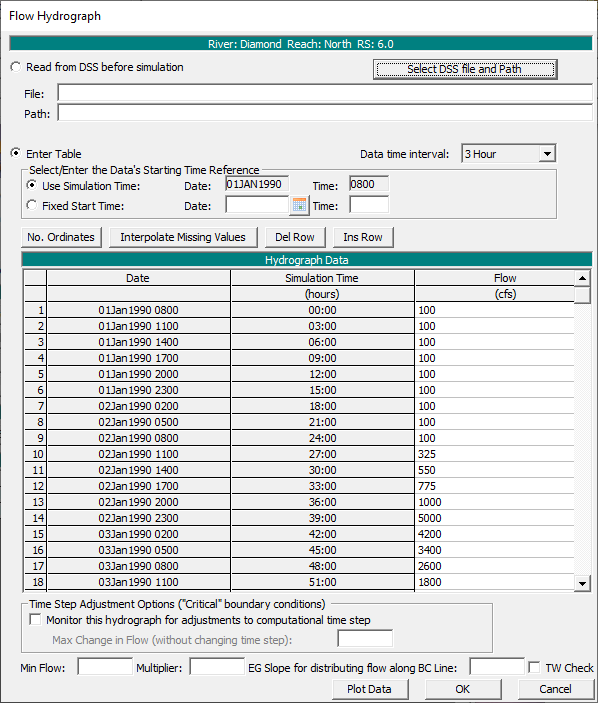
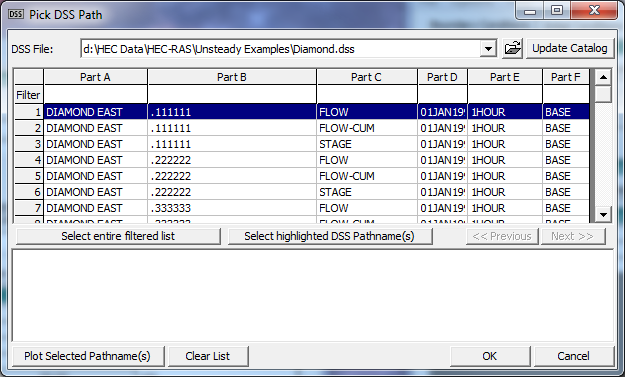
The user may also select to read hydrograph data from a DSS file. To do this the user presses the button Select DSS file and Path. When this button is pressed a DSS file and pathname selection screen will appear as shown in the figure below. The user first selects the desired DSS file by using the browser button at the top. Once a DSS file is selected, a list of all of the DSS pathnames within that file will be displayed in the table. The user can use the pathname filters to reduce the number of pathnames shown in the table. When the desired DSS pathname is found the user closes the window and the filename and pathname will be recorded in the Flow Hydrograph Window.
Downstream Boundary Condition
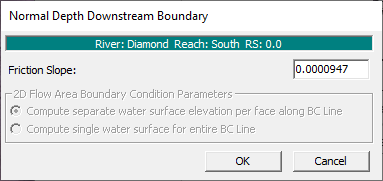
For River Station 0.0 of the South Reach the boundary condition selected was normal depth. Again, the corresponding cell for that particular river station was highlighted and the Normal Depth button was selected. The window shown in the figure below is then displayed and a value of 0.0000947 was entered. This method requires the user to enter a friction slope for the reach in the vicinity of the boundary condition, the slope of the water surface is often a good estimate of the friction slope.
Initial Conditions
Initial conditions consist of flow and stage information at each of the cross sections, as well as elevations for any storage areas defined in the system. Data for initial conditions is established by selecting the Initial Conditions tab on the Unsteady Flow Data Editor. After selecting the tab, the following figure will be displayed.
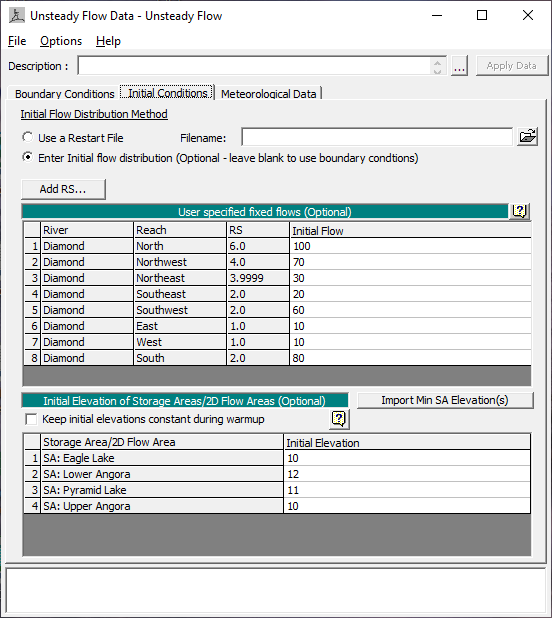
Flow data was entered for each reach so the program could perform a steady-flow backwater run to compute the corresponding stages at each cross section. As shown on the figure above, the North Reach has an initial flow of 100 cfs, corresponding to the baseflow of the hydrograph entered as the upstream boundary condition. The other various reaches then split the 100 cfs of flow down to the South Reach where the flow combines to 80 cfs. In addition to flow data, initial elevation for each storage area is needed. Initial elevations were set to 11, 10, 12, and 10 feet for Pyramid Lake, Eagle Lake, Lower Angora, and Upper Angora, respectively. The data was then saved in the Unsteady Flow Data Editor and the window was closed.
Unsteady Flow Analysis
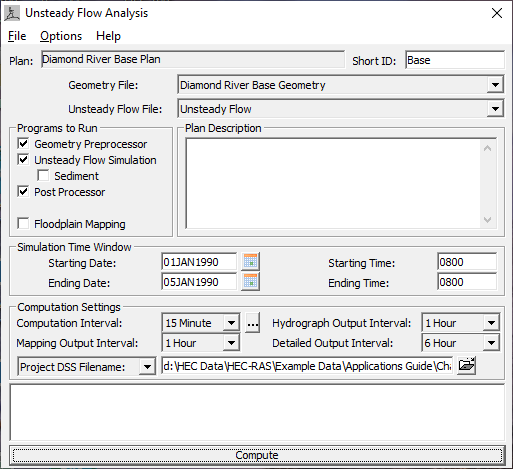
After the geometry and unsteady flow data have been completed an unsteady flow analysis may be initiated. Under the main program window Unsteady Flow Analysis was selected under the Run menu. This will display the Unsteady Flow Analysis Window shown in the figure below. A plan was defined by selecting the Geometry File "Diamond River Base Geometry" and the Unsteady Flow File "Unsteady Flow." Under the File menu, Save Plan As was selected and the plan title was entered as "Diamond River Base Plan." After entering the title of the plan a short identifier was entered as "Base" and the plan was saved.
Simulation Time Window
The simulation time window, located on the figure above, requires a beginning and ending date and time for simulation. The date must have a four digit year and can be entered in either of the two following formats: 01Jan1990 or 01/01/1990. For this application the date was saved in the first format. The time field is entered in military time (i.e. 1 p.m. is entered as 1300). For this application the simulation time began and ended at 0800.
Computation Settings
The computation settings in the Unsteady Flow Analysis Window contain the following: the computational interval; hydrograph output interval; instantaneous profiles interval; and the name and path of the output DSS file.
For this example the computation interval was set to 15 minutes. The computation interval should be small enough to accurately describe the rise and fall of the floodwave. The hydrograph output interval was set to 1 hour. This interval defines the output of computed stage and flow hydrographs written to HEC-DSS. The detailed output interval was set to 6 hours, specifying the interval at which detailed hydraulic output will be computed by the post processor. It is suggested that this interval remain fairly large to reduce the amount of post processing and storage required. The path selected for the output to DSS was "C:\HEC\RAS\Unsteady\Diamond.dss."
Location of Stage and Flow Hydrographs
The user has the option of specifying locations to have hydrographs computed and available for display. The user may select individual cross sections, groups of cross sections, or entire reaches. From the Options menu on the Unsteady Flow Analysis Window, the Stage and Flow Output Locations option was selected, displaying the figure below. For this example "All Reaches" was selected. This option will compute hydrographs at every cross section in the data set. If the user is working with an extremely large data set, computation time and data storage can be reduced by only selecting the most essential cross sections for output.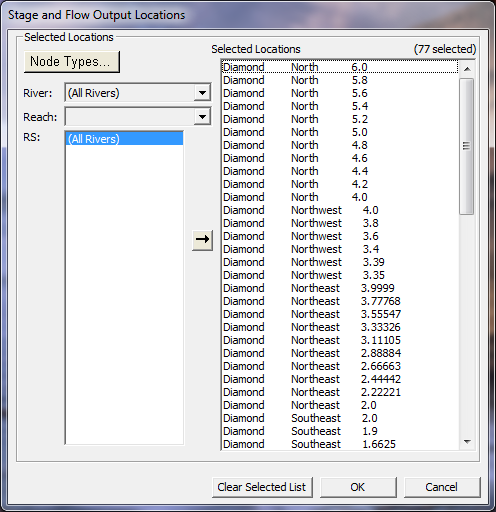
Unsteady Flow Simulation
There are three components used in performing an unsteady flow analysis within HEC-RAS: the geometric data preprocessor (HTAB); the unsteady flow simulator (UNET); and an output post processor.
Geometry Pre-processor (HTAB)
The geometry pre-processor is used to speed up the unsteady flow calculations by processing the geometric data into a series of hydraulic property tables and rating curves. It is highly recommended and illustrated in this example that the user run the geometry pre-processor and examine hydraulic output for anomalies before running the unsteady flow simulator and the post-processor.
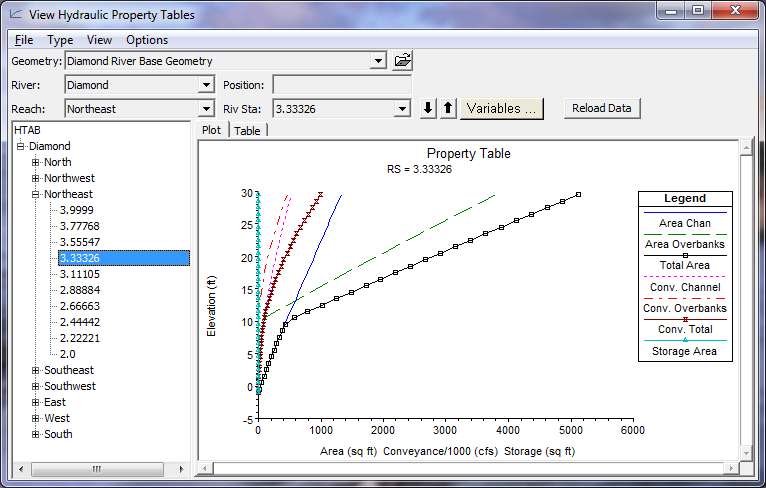
The Geometry Pre-processor box under "Programs to Run" was selected in the Unsteady Flow Analysis Window. The Unsteady Flow Simulation and Post-Processor boxes were unselected (no checkmarks) and the Compute button was depressed. After the geometry pre-processor finished processing the data, Hydraulic Property Plots was selected from the View menu on the main program menu. The figure below displays a typical cross section plot of hydraulic properties for this example. Cross sections are processed into tables of elevations versus hydraulic properties of areas, conveyances, and storage. Viewing these plots for anomalies is a good diagnostic tool to search for cross sections with irregular geometry.
The geometry pre-processor evaluates hydraulic structures such as bridges and culverts and relates the structures as a function of tailwater, flow, and headwater. From the Type menu in the Hydraulic Properties Tables, Internal Boundaries was selected. Next, the South Reach was selected displaying the figure below, the family of rating curves for the bridge located at RS 1.895. On the plot the free flow rating function describes the flow if tailwater submergence does not occur, such as free flow over a weir. Above the free-flow rating function is a family of submerged flow rating curves, one for each tailwater elevation.
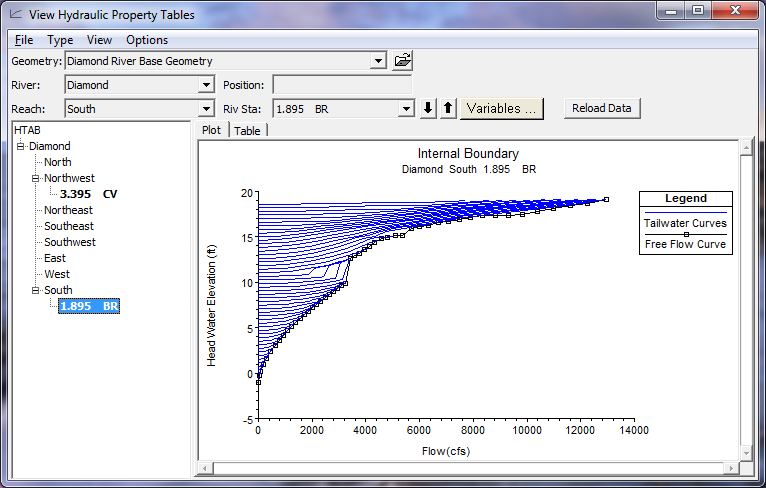
As shown in the figure above, there is a transitional area to left of the free flow curve between 10 and 12 feet of elevation where the lines of constant tailwater extend vertically. This occurs because at this water elevation flow begins to contact the upstream side of the bridge, causing backwater. This is a transition zone where free surface flow changes to orifice flow. This type of flow is unpredictable because the flow is changing from free surface flow to a "sluice gate type" of pressure flow and then possibly to a full flowing orifice flow.
Unsteady Flow Simulation and the Post-Processor
After the hydraulic property tables were examined the Geometry Pre-processor box was unselected on the Unsteady Flow Analysis Window and the Unsteady Flow Simulation and Post-Processor boxes were selected. Then the Compute button was depressed.
The output from the simulation can be viewed from many different tables and graphs. The most interesting output for this example is found by viewing the stage and flow hydrographs. From the main program window, View and then Stage and Flow Hydrograph was selected. By selecting the Type menu on the Stage and Flow Hydrograph Window the user can view stage and flow hydrographs for cross sections, bridges, culverts, inline structures, lateral structures, storage areas, storage area connections, and pump stations.
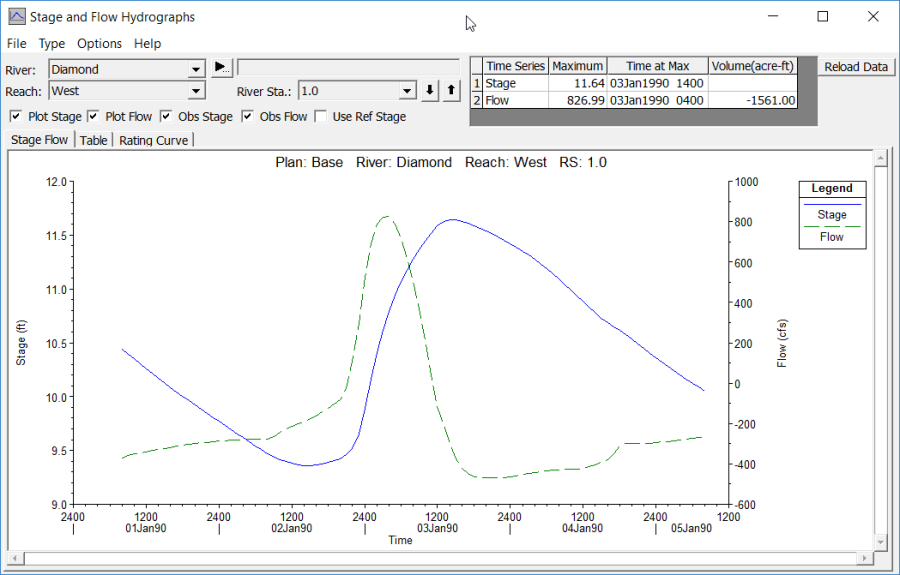
First, the "Cross Section" option was selected from the Type menu and the reach was set to West, displaying the figure above. As seen from the figure, the flow was initially negative, denoting that at the beginning of the simulation time flow was moving away from Pyramid Lake. As the floodwave progressed the flow changed to positive, implying a reversal in the direction of flow towards Pyramid Lake. After the floodwave passed, the direction of flow returned to flowing away from Pyramid Lake. The stage and flow can also be viewed as tabular output by selecting the Table tab located on the Stage and Flow Hydrograph Window. The output will be displayed in the increment set on the hydrograph output interval located in the Unsteady Flow Analysis Window.
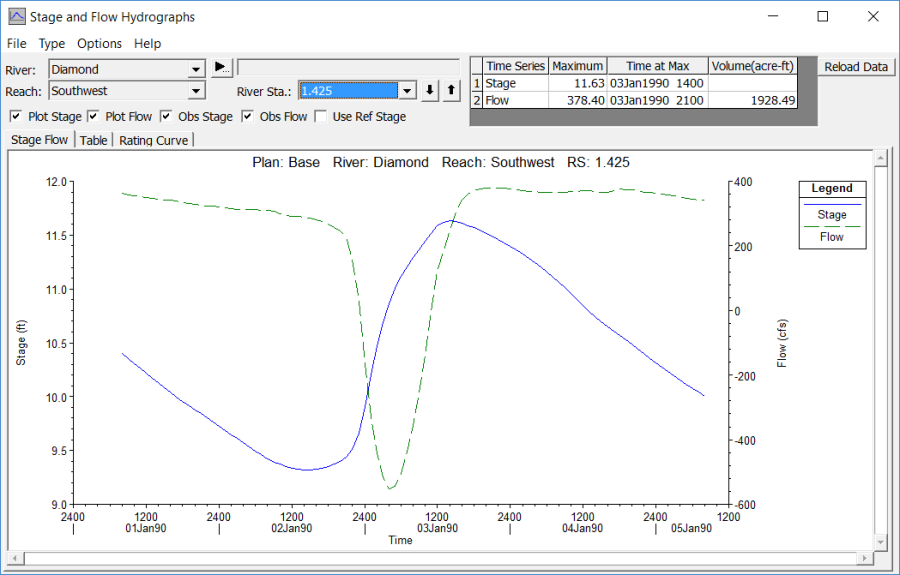
The geometric data set was constructed with relatively no slope to emphasize the ability of RAS to model unsteady flow, including flow reversals. As seen in the previous figure for the Southwest Reach, the flow reverses direction during the peak of the floodwave. This flow reversal occurs because water is diverted to the West Reach and to the lateral weir on the Southwest Reach. These diversions decrease the flow in the Southwest Reach compared to the flow in the Southeast Reach. The discrepancy in flows between the two reaches causes a significant difference in water surface elevations at the Lower Junction. The difference in water surface elevation forces water to move upstream on the Southwest Reach during the floodwave.
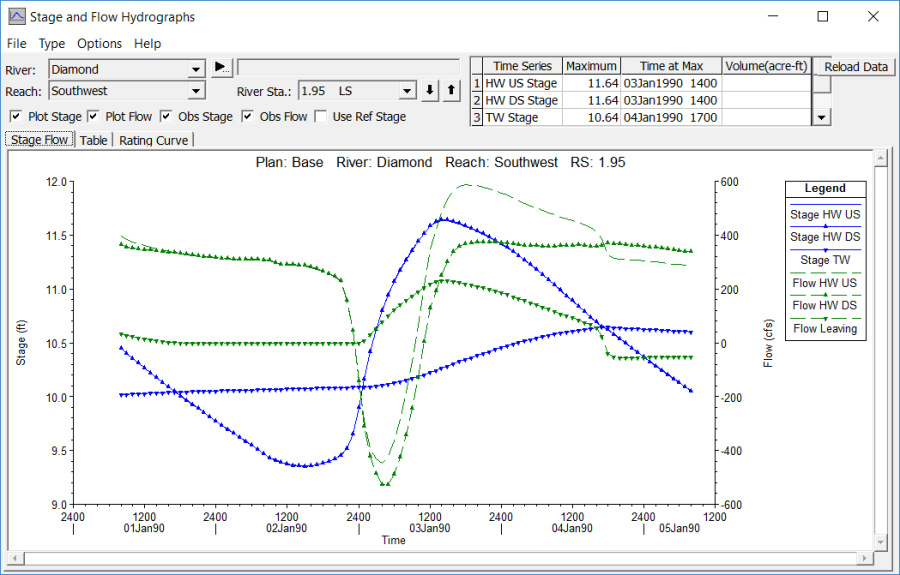
Next, the Lateral Structure option was selected from the Type menu and the reach was set to Southwest, displaying the figure below. As shown in the figure below, the lateral weir is affected by the flow reversal on the Southwest Reach. Additionally, the tailwater stage for the lateral weir rises above the headwater stage twice during simulation, causing flow to enter the reach from the lateral weir.
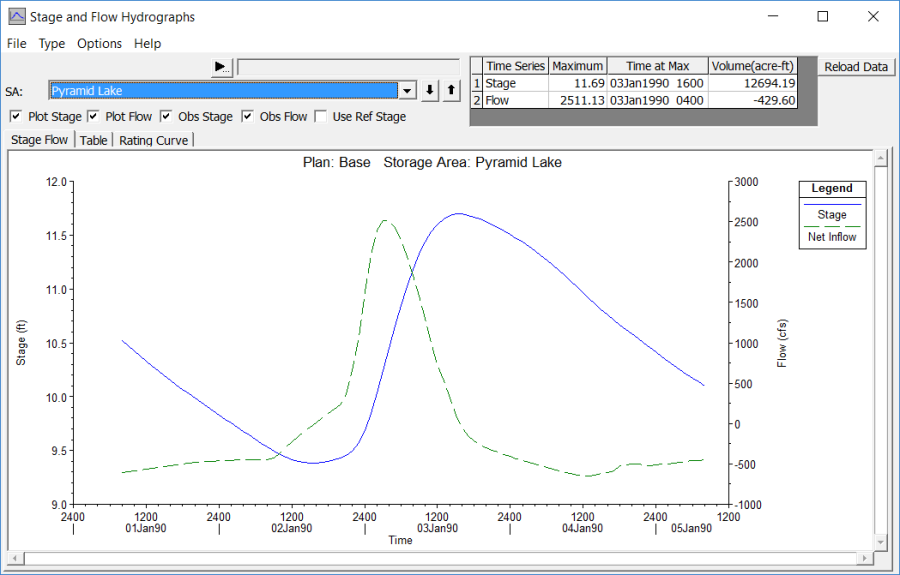
In addition to viewing output directly from the Stage and Flow Hydrograph Window the user can open the Geometric Data Editor and select to view output by clicking on the desired feature. From the Geometric Data Editor the storage area "Pyramid" was selected by clicking on it with the mouse. Plot Stage and Flow Hydrograph was selected, displaying the figure below.
As shown in the figure below, the stage of the storage area steadily decreases because flow is leaving the storage area until the floodwave passes through, causing the stage to increase. The stage of the storage area then begins to decrease again after the floodwave.
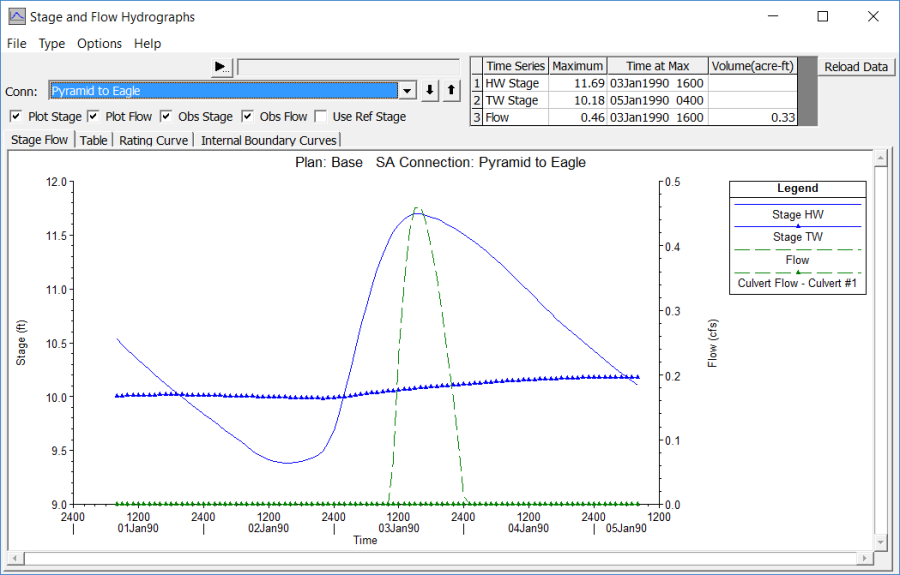
Finally, from the Geometric Data Editor the storage are connection "Pyramid to Eagle" was selected, displaying the figure below. Initially, there is no flow in this connection. This occurs because the stage is below the low invert elevation of the culvert at 11.5 feet. When the stage increases to over 11.5 feet the flow rate steadily increases, as shown on the figure below.
Summary
The concept of unsteady flow analysis within a network of channels and storage areas was discussed. This example demonstrates the ability of HEC-RAS to route a hydrograph through a network of channels containing junctions, culverts, bridges, storage areas, lateral weirs, and hydraulic connections.
nsteady flow analysis can be extremely difficult compared to steady flow analysis because input parameters can cause instabilities in calculations. Instabilities can cause the program to fail to converge on a solution. It is highly recommended that the user have experience with unsteady flow modeling. Refer to Chapter 8 of the User's Manual for additional information on unsteady flow analysis.