Download PDF
Download page Wilcock and Crowe.
Wilcock and Crowe
Wilcock and Crowe (2003) is a bedload equation designed for well-graded (poorly-sorted) rivers containing both sand and gravel. It is a "surface" transport method based on the theory that transport depends on the material in direct contact with the flow and it is the bed surface that modulates bed mobility. It was developed based on the surface gradations of flumes and rivers and sediments with bulk sand contents between 6-34%. The beds were often armored with much lower sand content on the surface than in the subsurface. Therefore, users should choose active layer algorithms and gradations should reflect the bed surface properties. Always use this function with the Active Layer bed mixing method and consider defining separate, initial active layer gradations to reflect the cover layer.
The Wilcock and Crowe equation is based on the ratio of the shields number (τ*) to a "reference shields" number (τri*), making it a sort of excess shear stress. The reference shields parameter is comparable to the critical Shields parameter in MPM or Laursen-Copeland, but recognizes that rivers transport trace sediment volumes at very low shear stresses. Therefore, instead of defining a "critical" shear stress, below which no particles move, this function uses a refence shear stress where transport is trivial. The factor 0.002 in the transport equation below corresponds to the reference transport rate.
They define transport Wi* as two functions of the dimensionless shear ratio τ*τri*: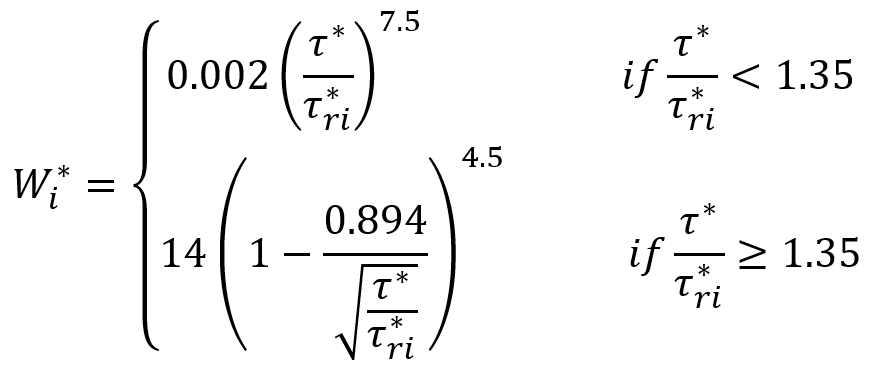
The Wilcock and Crowe approach is distinct from the other transport functions because include a hiding equation that accounts for grain class inter-dependence. When a single grain size is used to represent the sediment mixture, the transport equation assumes the same reference shear stress will mobilize all the sizes. This is accurate for very well mixed sediments but becomes less accurate as a sediment grain size distribution develops. In the figures shown below, the grain size distribution of the bed sediment shown in brown (graph A below) is well mixed (or poorly sorted) and the grain size distribution of the bed sediment shown in brown (graph B below) is poorly mixed (well sorted). Both are representative of natural gravel and sand river systems. The influence of mixture on grain inter-dependence causes the sizes in the brown mixture to mobilize at a similar critical shear stress for all but the largest grains. In graph C below, the critical shear stress curve is near flat until the largest size fractions. In contrast, the green sediment, which is poorly mixed / well sorted, has a much larger range of critical shear stresses at which the different grain size fractions mobilize. Transport of the brown sediment could be reasonably approximated using the d50 grain size and a single critical shear stress value. Transport rates for the green sediment require grain size specific calculations. The Wilcock and Crowe model accounts for this inter-dependence and sensitivity of critical shear stress on grain size mixture through a hiding factor that explicitly incorporates grain size.
The last two decades of graded sediment transport research suggests that gravel and cobbles affect sand transport and visa versa. Wilcock and Crowe quantify grain class dependence with hiding and sand dependent gravel transport equations:
Hiding: Wilcock and Crowe computes the inter-dependence of grain sizes and the influence on mobility and transport with a hiding function. The hiding function relates the transport potential of bed surface to the distribution of finer and larger sizes.
Where there is a small amount of sand on the surface, sand nestles between larger gravel clasts, which reduces the bed shear it experiences. In this way coarse clasts reduce the transport of fine particles to occurring only when a large grain is mobilized. In contrast, gravel transport increases with sand content. As sand content of the bed surface increases, it 'lubricates' the bed, depositing between surface gravels and reducing the framework integrity. Once mobilized, the gravels are transported more easily over the sandier bed surface.  bed surface with a well-mixed grain size distribution and small amount of sand on the surface. B) bed surface with a poorly mixed grain size distribution and larger amount of sand on the surface. C) measured critical shear stresses for each grain size fraction in the two mixtures.")
Wilcock and Crowe adjusts the reference shear (τri*) for the specific grain size class using the base reference shear (τrm*) for the median grain class, the ratio of the grain class particle size (di) on the surface to the median mixture surface grain size (dsm), and the hiding factor, b:
| \tau_{ri}^* = \tau_{rm}^* \left( \frac{d_i}{d_{sm}} \right) ^b \space and \space b = \frac {0.67}{1+exp \left( 1.5 - \frac{d_i}{d_{sm}} \right)} |
Modeling Note:
Modeling Note: HEC-RAS version 6.0 included hiding features independent of the transport functions. Because Wilcock and Crowe includes a hiding algorism, modelers should not use it with the generic hiding features in the Bed Mixing Options. Adding a hiding feature to this transport function would double-count the process.Wilcock and Crowe also include this effect in the base reference shear stress (τrm*). The reference shear is a function of the sand content (FS) of the bed surface (in percent):
| \tau^*_{rm} = 0.021 + 0.015e^{-20FS} |
The equation for base reference shear stress is derived using the surface sand content, as shown in the figure below. The reduction in reference shear stress occurs for both sand content on the bed surface and in the subsurface. However, the equations in the Wilcock and Crowe model are fit to the surface sand.

The figure below illustrates the influence of the sand content on the bed surface over the reference shear stress for the sand and gravel fractions. As the sand content increases and sand becomes able to transport independent of gravel movement, the reference shear stress for sand decreases from a maximum of 0.8 to a minimum of 0.04. At the same time the reference shear stress for the gravel fraction decreases from 0.04 to 0.01 as the increase in sand on the bed surface makes it easier to transport. 
As the sand content increases: the reference shear decreases, increasing the excess bed shear, and total transport. This equation is very sensitive to this sand content parameter, making field data collection of a separate gravel count and surface sand content estimate very important.
Modeling Note - Calibrating Wilcock and Crowe:
To calibrate Wilcock & Crowe (2003), adjust the mobility scaling factor, which will be allied to trm. Adjusting trm corrects error in the drag partition or other site-specific mobility factors while preserving both the hiding function and the transport function. Choosing to specify t*rm directly, overwrites the mobility parameter and loses the sand dependence from the t*rm equation above
Modeling Note - Sensitivity to Surface Grain Size Distribution Bias:
Surface gradations are usually measure with Wolman pebble counts or photoseiving. Numerous studies have shown that manual particle count surveys tend to be biased against the largest and smallest size fractions, particularly random walk methods in the water. See Bunte and Abt (2001) Sampling surface and subsurface particle-size distributions in wadable gravel- and cobble-bed streams, for a discussion of common surface gradation sample biases and best practices. The gravel count should be truncated at 8 mm at the finer end and 128 mm at the courser end. When truncating, sampled grains are grouped together as 'finer than' or 'greater than' and a visual estimate is made of the percent bed surface cover by the fractions. A grid-based sampling system reduces the error associated with random walks and selection by touch. Particles as small as 4 mm may be counted when using a grid. Pebble counts also bias the percent of sand on the bed. Therefore, the sand component should be estimated by eye. "Photoseiving" also includes biases. Overlapping or buried particles tends to underrepresent the coarser grain classes by as much as 20%. Surface based transport methods are sensitive to these gradations and will be affected by biased measurements.
This modeling note is based on recommendations from transport function developer Dr. Joanna Curran (Crowe).
Transport Capacity
Once HEC-RAS computes transport potential, applying the transport equation to each grain class, (i.e. as if the system was composed of 100% of that grain class) the model must translate that into the actual grain class transport, as a function of the composition of the sediment mixture. The transport capacity prorates the transport potential, reducing the transport of each grain class based on its prevalence in the bed.