Download PDF
Download page Specific Gage Post-Processor.
Specific Gage Post-Processor
Note: The Specific Gage Tool was redesigned in version HEC-RAS 6.0 and will be different than previous versions. Previous versions ran this process as part of a sediment simulation. The new version is a post-processor that creates new geometry files from the HDF5 output files.
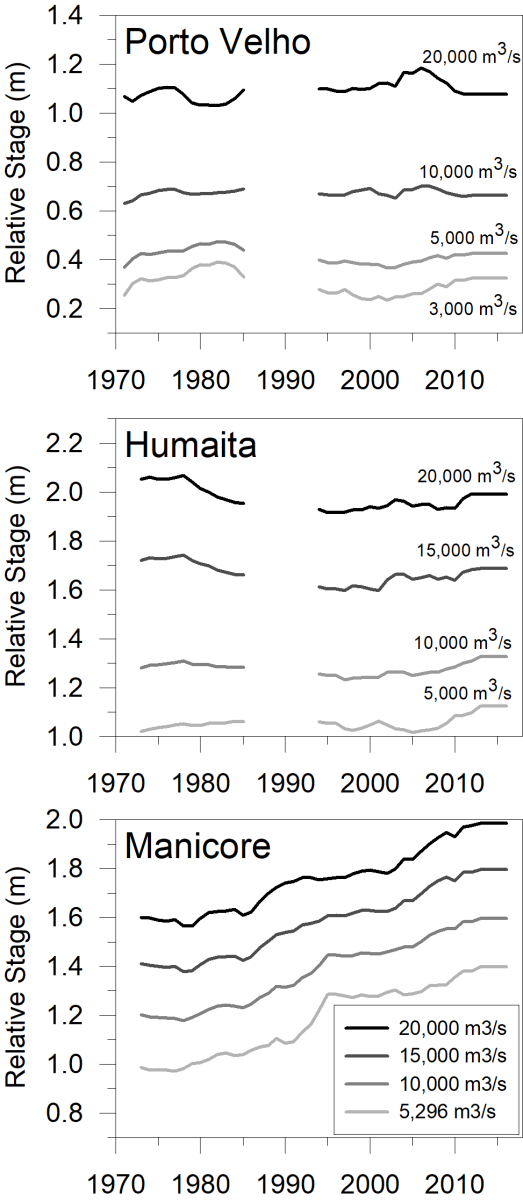
A specific gage analyses can be a useful way to measure and calibrate long term aggradation and degradation in settings with abundant historical water surface elevation data but little bed elevation information. Specific gage analyses tracks the water surface elevations associated with defined flows, to evaluate historical aggradation or degradation without direct bed elevation evidence (below). .")
With the Specific Gage capability in HEC-RAS users can compare movable bed simulations to historic specific gage data. The current version of HEC-RAS includes a Specific Gage post-processor which converts mobile bed simulation results into geometry files and then runs repeated steady flow analyses to produce the data required to generate Specific Gage plots. To perform a Specific Gage Analysis elect *Options→Sediment Output Options and Tolerances* in the Sediment Analysis Window (below).

The Specific Gage Post processor performs a steady flow analysis with consistent, pre-defined flows, and geometries mined from the HEC-RAS sediment output. At each date and time specified in the Specific Gage Plot editor HEC-RAS will:
- Create a new geometry file from the sediment output (updated cross sections) at the output time step closest to that specified in the Specific Gage Plot editor.
- Create a new Steady Flow plan for each selected date by pairing the new geometry with the Steady Flow file selected in the dropdown box.
- Copy the flow file and save the new geometry and plan files in a new project in a new sub-folder.
- Run each steady flow plan.
- Create a table with the water surface elevation at each cross section from each intermediate sediment output geometry for each flow specified in the steady flow editor.
The Specific Gage feature is a Steady Flow post-processor that inherits evolving cross-section data over time, from the sediment output files. It creates a series of dated, steady flow, plans and runs the steady flow engine to compute water surface elevation time series at each cross section. The Specific Gage feature requires a Steady Flow file. Therefore, create a Steady Flow file and run it with the initial sediment geometry to test it.

The steady flow file should include the flows targeted for water surface elevation trend analysis and must be a complete steady flow file with all of the data required to perform a steady flow analysis with the geometry file used in the sediment transport analysis (e.g. downstream boundary conditions, reservoir elevations, gate settings, etc…).
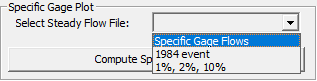
After creating a steady flow file and testing it with a Steady Flow simulation, open the Sediment Output Options and Tolerances editor from the Options menu of the Sediment Analysis dialog (from the original Sediment Analysis project and plan). Select the steady flow file created for the Specific Gage analysis in drop down box as depicted in the figure below. Then press the Compute Specific Gage button (below).
HEC-RAS will prompt for an "Analysis Name." The analysis will generate several steady flow files and output, so it creates a sub folder in the project directory with this name. Define the name of the analysis in this dialogue (below) and make sure the name is unique, and not the name of any existing folders.
.")
HEC-RAS will then launch a dialogue with all of the sediment output profiles, named by their simulation dates. Select (double click or press the ![]() button) the times that the Specific Gage analysis should evaluate water surface elevations for the constant flows (below).
button) the times that the Specific Gage analysis should evaluate water surface elevations for the constant flows (below)..")
Then press OK to launch the post processor. This will prompt the user for a file name, will generate a new project file in a sub folder (using the name provided), create a geometry file from the sediment output of the active plan at each specified date/time, pair each with the flow file by creating steady flow plans for each, run each steady flow plan. After the analysis the steady flow project, plans, and output exist in the sub folder and can be reviewed or analyzed independently. However, the Specific Gage feature also consolidates the water surface profiles for each flow in the steady flow file for each date in the Specific Gage editor in a table (below) that can be easily translated into Specific Gage plots.


Modeling Note: Other Uses for the Specific Gage Feature
Since the Specific Gage analysis was added, users have leveraged it for several alternate analyses. Any analyses that requires steady flow analyses at intermittent times in a sediment transport analyses (e.g. loss of reservoir storage, flood mapping) can use the Specific Gage tool to generate a project with separate steady flow runs using geometries from intermediate times in a sediment transport model.Modeling Note: I press OK and nothing happens
Make sure a sediment plan with simulation results is open and is the active plan.Wish List: Alternate (easier) specific gage analysis tool
Another way to analyze specific gage results would involve plotting computed stages within user-specified flow ranges (potentially, with observed data) in the Sediment Plotter.