Download PDF
Download page Output Variables.
Output Variables
The description of the variables in each output level in the Output Level Section describes each output variable, categorized by available level. The Output Variables are listed here in alphabetical order with more description, example visualizations, and modeling notes.
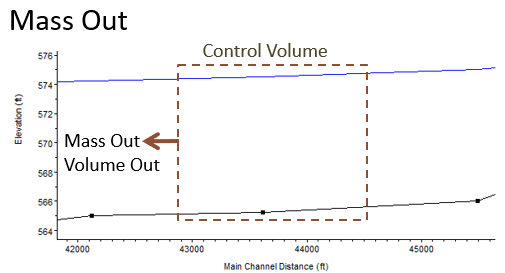
Two types of output, control volume terms (Mass In, Out, and Bed Change) and the results associated with each layer in the different bed mixing options are depicted in the Figures below.


Sediment Transport Output Variables
Variable Name | Units (US/SI) | Description |
|---|---|---|
| Active Thickness | ft/m | Thickness of the active layer at the start of each computational time step. Used in the simple active layer bed sorting and armoring routine. |
Armor Reduction: All | fraction | Fraction that the total sediment transport capacity is reduce to, based on the concepts of a cover layer computation. |
| Armor Reduction: Class 1-20 | fraction | Fraction for each individual grain size, that the transport capacity is reduce to, based on the concepts of a cover layer computation. |
| Ch Froude Num | - | Main channel Froude number at the end of the current computational time step. |
| Ch Invert El | ft/m | Minimum elevation of the main channel at each output time step. |
| Ch Manning n | s/ft1/3 s/m1/3 | Main channel manning's n value. |
| Cover Thickness | ft/m | Thickness of the cover layer at the end of each computational time step. Used in the Exner 5 bed sorting and armoring routine. |
| d16 Cover/Subsurface/Inactive | ft | The 16th percentile particles size of the specified mixing layer. Some practitioners prefer the d16 to d10 because it is two standard deviations below the mean. |
| d84 Cover/Subsurface/Inactive Layers | - | The 84th percentile particles size of the specified mixing layer. Some practitioners prefer the d84 to d90 because it is two standard deviations above the mean. |
| d50 Active | mm | d50 of the active layer of the simple active layer bed sorting and armoring routine. |
| d50 Cover | mm | d50 of the cover layer at the end of the computational increment. Used in the Exner 5 bed sorting and armoring routine. |
| d50 Inactive | mm | d50 of the inactive layer at the end of each computational time step. Used in the Exner 5 and simple active layer bed sorting and armoring routine. |
| d50 Subsurface | mm | d50 of the surface layer material at the end of the computational time step. Used in the Exner 5 bed sorting and armoring routine. |
| d90 Active | mm | d90 of the active layer of the simple active layer bed sorting and armoring routine. |
| d90 Cover | mm | d90 of the cover layer at the end of the computational increment. Used in the Exner 5 bed sorting and armoring routine. |
| d90 Inactive | mm | d90 of the inactive layer at the end of each computational time step. Used in the Exner 5 and simple active layer bed sorting and armoring routine. |
| d90 Subsurface | mm | d90 of the surface layer material at the end of the computational time step. Used in the Exner 5 bed sorting and armoring routine. |
| Dredge Vol Cum | ft3/m3 | Total volume of sediment removed from each cross section by the dredging routines. |
| Eff Depth | ft/m | Effective depth of the water in the mobile portion of the cross section, at the end of the computational time step. |
| Eff Width | ft/m | Effective width of the water in the mobile portion of the cross section, at the end of the computational time step. |
| EG Slope | ft/ft m/m | Slope of the energy grade line at each output time step. This can be a point value at the cross section or an average value between cross sections. |
| Fall Velocity | ft/s / m/s | Reports the fall velocity computed for each grain class. Also reports a "total" fall velocity which is a weighted average |
| Flow | ft3/s / m3/s | Total flow at the cross section for each output time step. |
| Hydraulic Radius | -- | The area of the channel (the part of the cross section between the movable bed limits) divided by the wetted perimeter of the channel. |
| Invert Change | ft/m | The total change in the invert (the lowest elevation station-elevation point between the bank stations) since the beginning of the simulation. |
| Invert Elevation | ft/m | The elevation of the channel invert of each cross section – the lowest elevation between the channel banks. |
| Invert Elevation Max | ft/m | The maximum channel invert (lowest elevation point between the channel banks) since the beginning of the simulation. |
| Invert Elevation Min | ft/m | The minimum channel invert (lowest elevation point between the channel banks) since the beginning of the simulation. |
| Lateral Load Mass | tons/ tonnes | This variable records the sediment entering the model through |
| Lateral Load Vol | ft3/m3 | lateral boundary conditions at each cross section and time step. It is only the lateral loads for the computation increment, not a cumulative value. Total and by grain class. |
| Lateral Structural Mass | tons/ tonnes | This tracks the sediment mass that is removed from each control volume (or added) by sediment associated with flow over a lateral structure. Total and by grain class. |
| Lateral Structural Vol | ft3/m3 | This tracks the sediment tvolume hat is removed from each control volume (or added) by sediment associated with flow over a lateral structure. Total and by grain class. |
| Long. Cum Mass change | tons/tonnes | Total change in bed mass (or Volume), cumulative in space and time. Spatial accumulation is from the current cross section to the upstream end of the river reach in which this cross section resides. |
| Long. Cum Mass Movable Limits | tons/tonnes | Sums the mass or volume change from the beginning of the simulation and from upstream-to-downstream, so that the downstream cross section at the last time step of the Longitudinal Cumulative Mass Curve (LCMC) is a summary of the total aggradation or degradation in that reach for the simulation. Comparing the full LCMC (or LCVC) to this one, that only reports the result in the movable bed limits, is a helpful way to differentiate between overbank and channel processes (e.g. determine what percentage of deposition is floodplain deposition or identify overbank deposition offsetting channel erosion). (Total and by grain class) |
| ||
| Mass Bed Change | tons/tonnes | Incremental total mass change in the bed for the current computational time step. |
| Mass Bed Change: Class 1–20 | tons/tonnes | Incremental mass change in the bed for the current time step. |
| Mass Bed Change Cum | tons/tonnes | Cumulative mass of the change in the bed elevation over time. |
| Mass Bed Change Cum: class 1-20 | tons/tonnes | Cumulative mass of the change in bed elevation over time, per grain size fraction (Bins 1 – 20). This only displays the size fraction bins that are being used. |
| Mass Bed Change Cum: Max | tons/tonnes | The maximum (positive) deposition in mass or volume since the beginning of the simulation. This result is monotonic. It only increases with time. |
| Mass Bed Change Cum: Min | (tons) | The maximum negative mass or volume change since the beginning of the simulation. This result is monotonic. It only decreases (larger negative value) with time. |
| Mass Capacity | tons/day tonnes/day | Transport capacity in total mass at the current computational time step. |
| Mass Capacity: Class 1-20 | tons/day tonnes/day | Transport capacity in mass, by grain size fraction, at the current computational time step. |
| Mass Cover | tons/tonnes | Total tons of material in the cover layer at the end of each computational time step. Used in the Exner 5 bed sorting and armoring routine. |
| Mass Cover: Class 1-20 | tons/tonnes | Tons of material in the cover later at the end of each computational time step, by individual grain size fraction. Used in the Exner 5 bed sorting and armoring routine. |
| Mass Dredge Cum | tons/tonnes | The total mass or volume dredged from that cross section since the beginning of the simulation. |
| Mass Inactive | tons/tonnes | Total tons of material in the inactive layer at the end of each computational time increment. |
| Mass Inactive: Class 1-20 | tons/tonnes | Tons of material in the inactive layer at the end of each computational increment, by individual grain size fraction. |
| ||
| Mass In | tons/tonnes | Total sediment mass, for all grain size classes, coming into the sediment control volume, per individual computational time step. |
| Mass In: Class 1-20 | tons/tonnes | Sediment mass entering the sediment control volume per grain size fraction, per computational time step by individual grain size fraction. |
| Mass In Cum | tons/tonnes | Cumulative total sediment mass entering the sediment control volume for a specific cross section since the beginning of the simulation. |
| Mass In Cum: Class 1-20 | tons/tonnes | Cumulative sediment mass entering the sediment control volume per grain size fraction, at a cross section since the beginning of the simulation. |
| ||
| Mass Out | tons/tonnes | Total sediment mass, for all grain size classes, going out of the sediment control volume, per individual computational time step. |
| Mass Out: Class 1-20 | tons/tonnes | Sediment mass leaving the sediment control volume per grain size fraction, per computational time step. |
| Mass Out Cum | tons/tonnes | Cumulative total sediment mass leaving the sediment control volume for a specific cross section since the beginning of the simulation. |
| Mass Out Cum: Class 1-20 | tons/tonnes | Cumulative sediment mass leaving the sediment control volume per grain size fraction, at a cross section since the beginning of the simulation. |
| Mass Subsurface | tons/tonnes | Total tons of material in the surface layer at the end of each computational time step. |
| Mass Subsurface: Class 1-20 | tons/tonnes | Tons of material in the surface layer at the end of each computational time step, by individual grain size fraction. |
| Mean Eff Ch Invert | ft/m | Average channel invert elevation computed by subtracting the effective depth of the main channel from the water surface elevation. |
| Mean Eff Ch Invert Change | ft/m | Change in the average channel invert elevation, which is computed by subtracting the effective depth of the main channel from the water surface elevation. |
| Movable Elv L and R | ft/m | These are the elevations of the movable bed limits. Tracking the MBL movement relative to the channel can be useful, but these are mainly used to track toe migration in BSTEM models. |
| Movable Sta L and R | ft/m | These are the stations (lateral stations of the station-elevation points) of the movable bed limits. These will remain constant unless the cross section has BSTEM parameters. Only the BSTEM algorithms move cross section station-elevation points laterally. |
| Reduce Armor Factor | -- | The Armor Reduction Factor determines how effective the cover layer is in the Thomas and Copeland mixing algorithms. It is the "Armoring Ratio" in Figure 217 and Figure 220. HEC-RAS multiplies the capacity deficit of each grain class by this ratio (computed from the "equivalent particle diameters " of coarser particles in the cover layer). An armor ratio of 1 is no armoring, 0 is complete armoring (for that grain class) and anything in between is partial armoring. |
| Sediment Concentration | (mg/l) | Total sediment concentration in mg/liter leaving of the sediment control volume at the end of the computational time step. This parameter is computed from the Mass Out and Flow results. Converting to concentration removes time from the result and allows comparison to sample durations that do not match the time step. |
| Sediment Discharge | tons/day tonnes/day | Total sediment discharge in tons/day leaving of the sediment control volume for a specific cross section, per individual computational time step. This is the Mass Out variable normalized to a daily flux. |
| Shear Stress | lb/sq ft Pa | Average shear stress of the movable portion of the bed at each time step. |
| Shear Velocity u* | ft/s m/s | Shear velocity. Used in Shields diagram and several sediment transport potential equations. |
| Slope | -- | This is the Energy Slope used in the shear stress equation, which is either computed locally at the cross section (Q/Conveyance)0.5 or the slope between the EGLs at the bounding cross sections. |
| Subsurface Thickness | ft/m | Thickness of the surface layer at the end of each computational time step. Used in the Exner 5 and simple active layer bed sorting and armoring routine. |
| Temperature | oF/oC | Water temperature. Current versions of the model only allow one temperature per time step, so this can vary in time but not space. |
| Thickens Inactive | ft/m | The vertical thickness of the deepest layer of the bed mixing (sorting and armoring) algorithm. All three methods use the same terminology for this. |
| Thickness Cover | ft/m | The vertical thickness of surficial layer of the bed mixing (sorting and armoring) algorithm. This is the Active Layer or the Cover Layer (in the Thomas or Copeland mixing methods). |
| Thickness Subsurface | ft/m | The vertical thickness of an intermediate layer between the cover and inactive layer in the Thomas and Copeland mixing algorithms. The Active Layer method does not have a comparable layer. |
| Toff Zone Capacity B | tons/day tonnes/day | The "Bed Zone" portion of the Toffaleti transport capacity. This is the MPM capacity if the Toffaleti-MPM function is selected. |
| Toff Zone Capacity L | tons/day tonnes/day | The Toffaleti transport capacity computed in the "Lower Zone" – approximately the bottom 8-9% of the water column, excluding the bed zone. Only written if the Toffaleti function is selected. |
| Toff Zone Capacity M | tons/day tonnes/day | The fraction of the Toffaleti transport capacity computed in the "Middle Zone" – approximately 31% of the water column in the zone between 1/2.5 Depth and 1/11.24 Depth (from the bottom of the channel). Only written if the Toffaleti function is selected. |
| Toff Zone Capacity U | tons/day tonnes/day | The fraction of the Toffaleti transport capacity computed in the "Upper Zone" – the top 60% (above 1/2.5 Depth from the bottom) of the water column. Only written if the Toffaleti function is selected. Modelers sometimes compare the upper three zones of Toffaleti Capacity to suspended load measurements (which exclude bed load). |
| Velocity | ft/s m/s | Average water velocity between the movable bed limits for each time steps. |
| Water Surface | ft/m | The water surface elevation at that at the cross section during the time step. |