Download PDF
Download page Levee Overtopping and Breaching.
Levee Overtopping and Breaching
Levee overtopping and breaching can be analyzed within HEC-RAS by modeling the levee as a lateral structure. When modeling a levee with a lateral structure, the area behind the levee should not be included in the cross section data of the main river. The cross sections should stop at the top of the levee. The lateral structure (levee) can be connected to a 2D Flow Area, a storage area, or another river reach. The strategy for modeling the area behind the levee will depend upon what will happen to the water if the levee overtops or breaches. If the water going over or through the levee will take many flow paths and have varying water surface elevations, then a 2D Flow Area is probably the most appropriate for modeling the area behind the levee. If the water going over or through the levee will fill up like a bathtub (Level pool water surface), then a storage area would be the most appropriate for modeling the area behind the levee. If the water will continue to flow in the downstream direction (and acting like a separate 1D channel), and possibly join back into the main river, then it may be more appropriate to model that area as a separate river reach. Shown in Figure 14-15 is an example schematic with a levee modeled as a lateral structure connected to a storage area to represent the area behind the levee. An example cross section with a lateral structure (levee) on the right hand side is shown in Figure 14-16.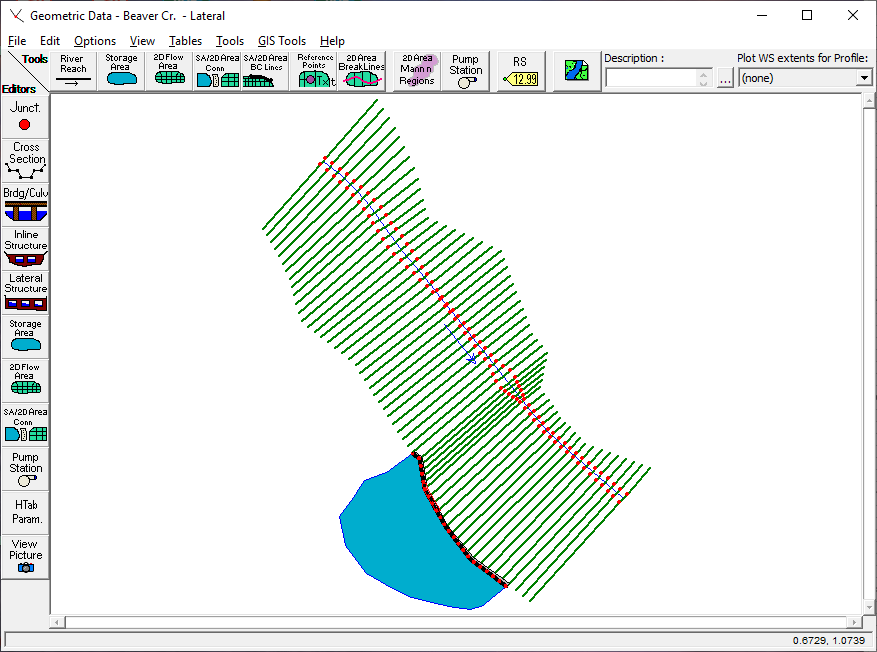
Figure 14 15. Schematic with Example Levee and Storage Area
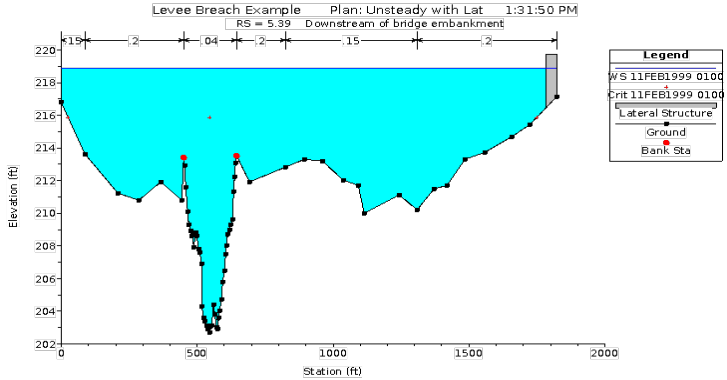
Figure 14 16. Example Cross-Section with Lateral Structure
The user defines the levee by entering a series of station and elevation points that represent the top of levee profile. This station and elevation data is then used as a weir profile for calculating the amount of water going over top of the levee. An example levee entered as a lateral structure is shown in Figure 14-17.
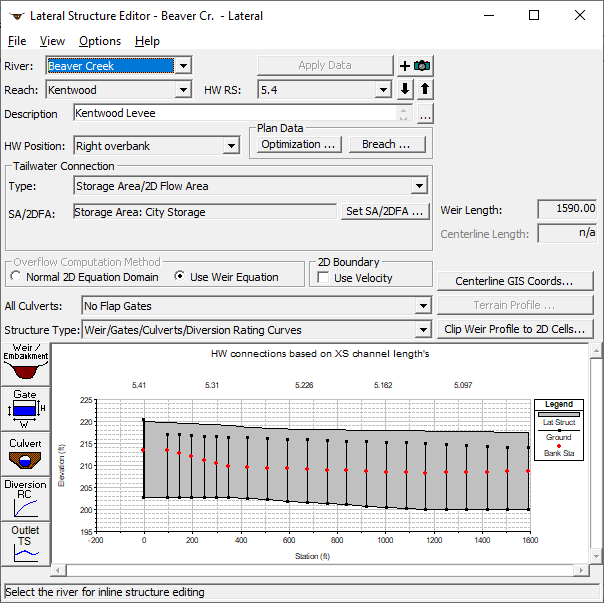
Figure 14 17. Lateral Structure Editor with Levee Modeled as a Weir.
In the example shown in Figure 14-17, the levee is connected to a storage area that will be used to represent the area behind the levee. As the levee overtops and/or breaches, the storage area will fill up until it reaches the same elevation as the water in the river. After the flood passes, the water in the storage area can pass back out any breach that may have occurred.
The levee information is entered as station and elevation data in the Lateral Weir/Embankment editor shown on the Lateral Structure editor. The station elevation data represents the top of the levee. The levee information is entered from the upstream end of the levee to the downstream end of the levee. An example of this editor with levee data is shown in Figure 14-18.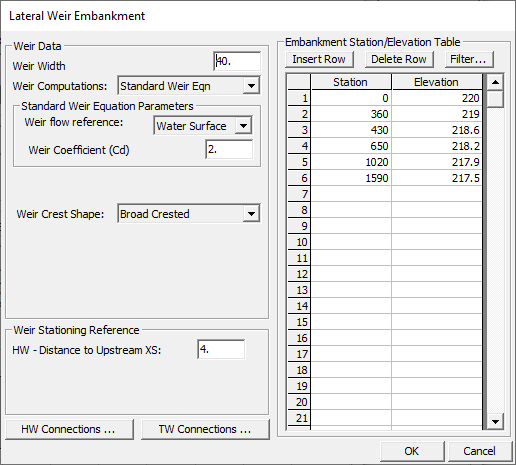
Figure 14 18. Lateral Weir/Embankment Editor with Example Levee Data
As shown in Figure 14-18, the user enters the width of the levee (which is only used for drawing purposes); the head reference for weir flow calculations; the lateral weir coefficient; the weir crest shape; the distance that the upstream end of the levee is from the nearest upstream cross section; and the station and elevation data representing the top of levee. For more information on this editor, see Lateral Structures in Chapter 6 of this manual.
Once the physical levee information is entered, the user can press the Breach button in order to bring up the levee breach editor. The user can have a single breach location per levee (Lateral structure). If more than one levee breaching location needs to be modeled, then break the levee into multiple lateral structures (one for each levee breach location). An example of the levee breach editor is shown in Figure 14-19.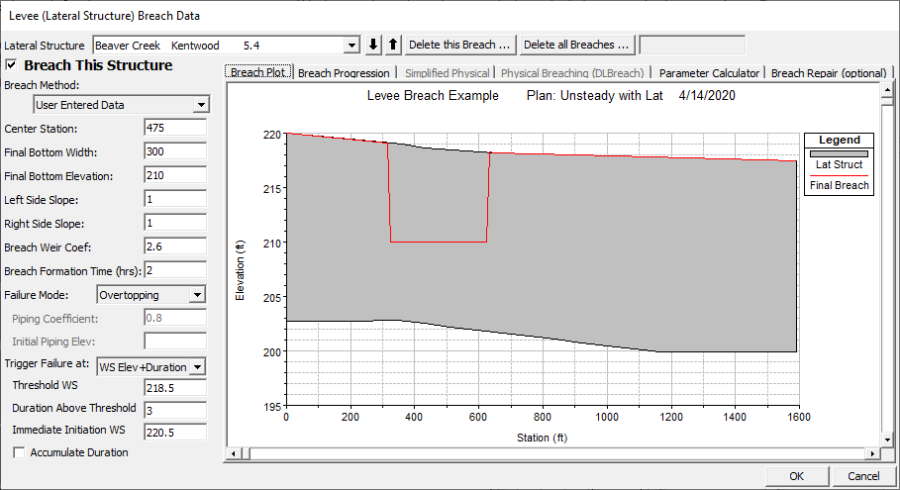
Figure 14 19. Levee Breach Editor with Example Levee and Breach
As shown in Figure 14-19, the information required to perform a levee breach is the same as performing a dam break. To get the details of each data field, please review the information found under the Dam Break section above in this chapter.
After all of the data are entered and the computations are performed, the user can view output for the lateral structure (levee). Plots such as the profile plot, lateral structure hydrographs, and storage area hydrographs, can be very helpful in understanding the output for a levee overtopping and/or breach. Shown in the figure below is an example profile plot with a levee breach. Shown in Figure 14-21 is a stage and flow hydrograph plot for the lateral structure. In this plot there are three stage lines and three flow lines. The stage lines represent; the stage in the river at the upstream end of the levee (Stage HW US); the stage in the river at the downstream end of the levee (Stage HW DS); and the stage in the storage area (Stage TW). The river is always considered to be the headwater, and the storage area is the tailwater. The flow lines on the plot represent: the flow in the river at the upstream end of the levee (Flow HW US); the flow in the river at the downstream end of the levee (Flow HW DS); and the flow leaving the river over the lateral weir to the storage area (Flow Leaving).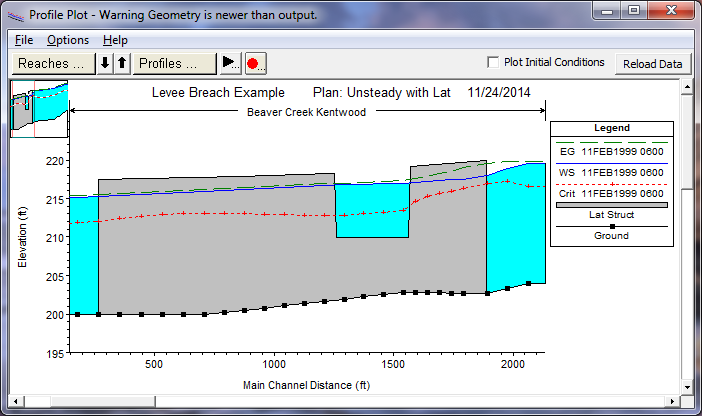
Figure 14 20. Profile Plot with Levee Breach 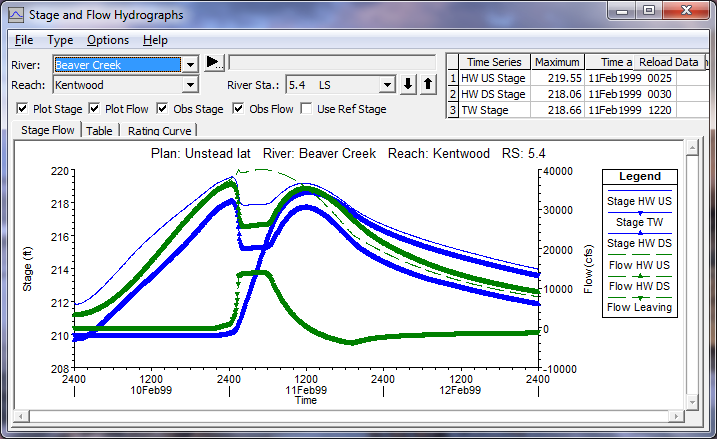
Figure 14 21. Lateral Structure Stage and Flow Hydrographs
In addition to the profile plot and the lateral structure hydrographs, it is a good idea to plot the stage and flow hydrographs for the storage area. This allows the user to easily see the amount of flow coming into and out of the storage area, and the change in the water surface elevation. Shown in Figure 14-22 is the stage and flow hydrograph for the storage area in this example.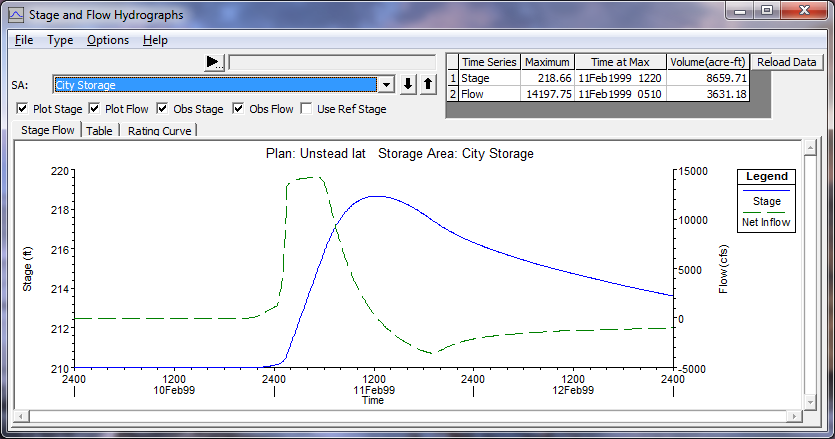
Figure 14 22. Stage and Flow Hydrograph Plot for Storage Area
Referring to Figure 14-21 and Figure 14-22, as the levee breaches, the flow going into the storage area and the stage increase quickly, while the stage and flow in the main river drop. In addition to the graphics in HEC-RAS, tabular results are also available. Shown in Figure 14-23 is a detailed output table for the lateral structure. The user can select a specific time line for viewing the output by selecting a specific profile. The profiles are labeled by the date and time they occurred in the model simulation.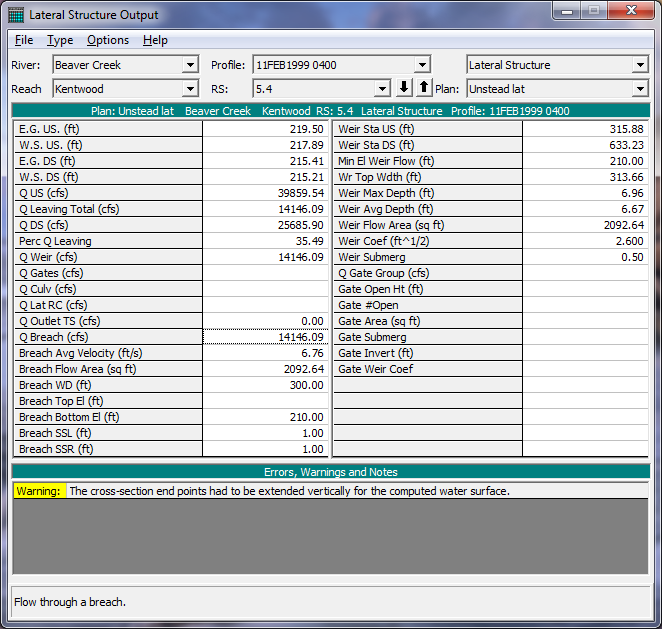
Figure 14 23. Detailed Tabular Output for Lateral Structure