Download PDF
Download page Importing Data from the HEC Data Storage System (HEC-DSS).
Importing Data from the HEC Data Storage System (HEC-DSS)
HEC-DSS is a data base system that was specifically designed to store data for applications in water resources. The HEC-DSS system can store almost any type of data, but it is most efficient at storing large blocks of data (e.g., time-series data). These blocks of data are stored as records in HEC-DSS, and each record is given a unique name called a "pathname." A pathname can be up to 391 characters long and, by convention, is separated into six parts. The parts are referenced by the letters A, B, C, D, E, and F, and are delimited by a slash "/" as follows: /A/B/C/D/E/F/
The pathname is used to describe the data in enough detail that various application programs can write to and read data from HEC-DSS by simply knowing the pathname. For more information about HEC-DSS, the user is referred to the "HEC-DSS, User's Guide and Utility Manuals" (HEC, 1995).
Many of the HEC application programs have the ability to read from and write to the HEC-DSS. This capability facilitates the use of observed data as well as passing information between software programs. The ability to read data from HEC-DSS has been added to HEC-RAS in order to extract flow and stage data for use in water surface profile calculations. It is a common practice to use a hydrologic model (i.e., HEC-HMS) to compute the runoff from a watershed and then use HEC-RAS to compute the resulting water surface profiles.
Reading data from HEC-DSS into HEC-RAS is a two-step process. First, the user must establish connections between HEC-RAS cross-section locations and pathnames contained in the HEC-DSS file. These connections are established by selecting the "Set Locations for DSS Connections" option from the File menu of the Steady Flow Data editor. When this option is selected, a window will appear as shown in Figure 6-7. The user selects cross-section locations for DSS connections by selecting a River, Reach, and River Station, then pressing the "Add selected location to table" button. When this button is pressed, a new row will be added to the table at the top of the window. The user should do this for all the locations where they want to establish connections to HEC-DSS data.
The next step is to open a particular HEC-DSS file. The user has the option of either typing the filename in directly, or using the open button, which is right next to the filename field. Once a DSS file is selected, a listing of the pathnames for all of the data contained in that file will appear in the table at the bottom of the window. The user can establish connections to more than one DSS file if desired.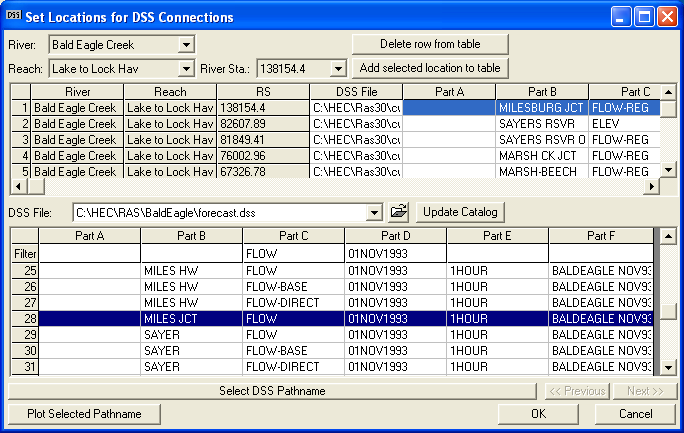
Figure 6 7 Editor for Setting Connections to HEC-DSS Pathnames
To establish the connection between an HEC-RAS cross section and a particular pathname in the DSS file, the user selects the row in the upper table that contains the river station that they want to connect data to. Next, they select the pathname that they want to connect to that river station from the lower table. Finally, they press the button labeled "Select DSS Pathname," and the pathname is added to the table at the top of the window.
To make it easier to find the desired pathnames, a set of pathname part filters were added to the top row of the lower table. These filters contain a list of all the DSS pathname parts contained within the currently opened DSS file. If the user selects a particular item within the list of one of the pathname parts, then only the pathnames that contain that particular pathname part will be displayed. These filters can be used in combination to further reduce the list of pathnames displayed in the table. When a particular filter is left blank, that means that pathname part is not being filtered.
Another feature on the editor to assist in selecting the appropriate pathnames is the "Plot Selected Pathname" button. This button allows the user to get a plot or a table of the data contained within any record in the DSS file. The user simply selects a DSS pathname, and then presses the Plot Selected Pathname button, and a new window will appear with a graphic of the data contained within that record.
Once all of the pathname connections are set, the user presses the OK button to close the editor. The next step is to import the data. This is accomplished by selecting "DSS Import" from the File menu of the Steady Flow Data editor. When this option is selected, a window will appear as shown in Figure 6 8.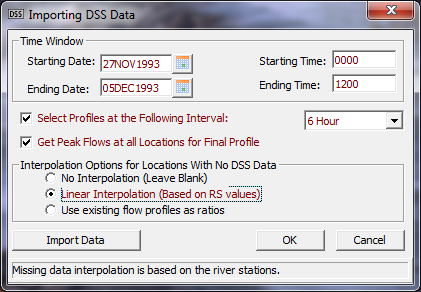
Figure 6 8 DSS Data Import Window
First the user sets a time window, which consists of a starting date and time and an ending date and time. When data are extracted from DSS, the program will only look at the data that is contained within the user specified time window.
Below the time window there are two options for selecting flow data to be extracted from the DSS file. The first option allows the user to pick off flow data at a specified time interval, starting with the beginning of the time window for the first profile. The second and subsequent profiles would be based on adding the user specified time interval to the start time of the time window. Flow data is extracted from the hydrographs at each of the locations being read from DSS. The second option listed on the window allows the user to get an overall peak flow for a profile computation. When this option is selected, the peak flow will be extracted from each hydrograph, within the time window specified. These peak flows will be made into the final profile in the flow data editor.
The bottom portion of the window contains options for interpolating flow data at locations that do not have hydrographs in the DSS file. After the flow data are read in, it will be necessary to interpolate flow data at all of the locations listed in the flow data editor that do not have values in the DSS file. Three options are available: no interpolation, linear interpolation, or using the flow data from an existing profile to calculated ratios for interpolating between points that have data. Once all the options are set, the user presses the "Import Data" button, to have the data imported and fill out the flow data editor.