Download page Viewing Results from the River System Schematic.
Viewing Results from the River System Schematic
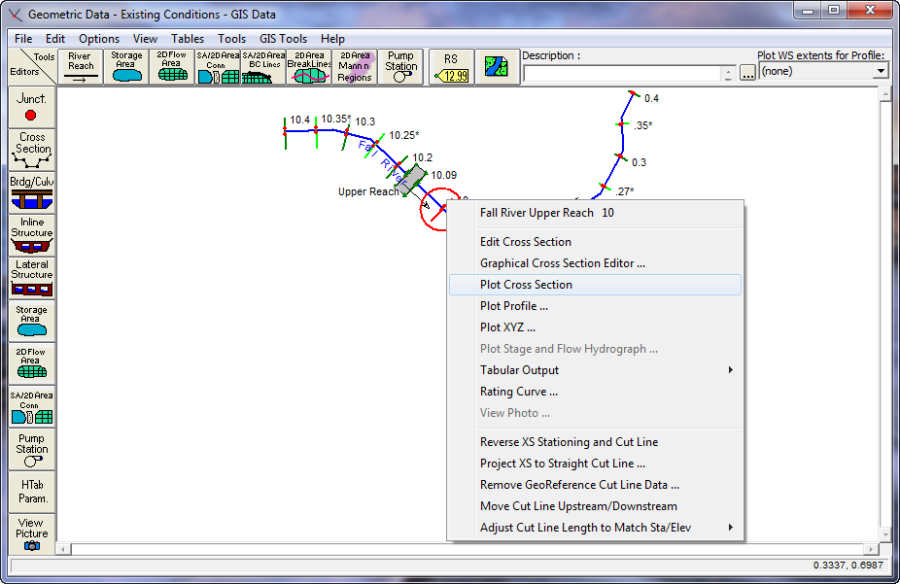
The user has the option of either bringing up graphics and tables from the View menu on the main HEC-RAS window (as discussed above), or from the river system schematic (found under geometric data). Once data have been entered, and a successful simulation has been made, the user can interact with the river system schematic. When the left mouse button is pressed over the river system schematic, a pop-up menu will appear listing options that are relevant to the area of the schematic that is located under the mouse pointer. An example of this is shown in Figure 8-27.
In Figure 8-27, the pop-up menu shown comes up whenever the user presses the left mouse button over a cross section. In this particular example, the mouse button was pressed over the cross section located at river station 9.9 of the Upper reach of Fall river. As shown in the menu, the user has the choice of editing the cross section data; plotting the cross section; plotting the profile for the reach containing this cross section; bringing up the XYZ plot for that reach; viewing tabular output; plotting the computed rating curve at this cross section; or viewing a picture of the location. Other popup menus are available for bridges; culverts; junctions; and reach data. Figure 827 Geometric Data Window with Popup Menu