Download PDF
Download page Modeling Pump Stations.
Modeling Pump Stations
Pump stations can be connected between storage areas; a storage area and a river; between a storage area and a 2D Flow Area; between two 2D Flow Areas; Between a 1D river and a 2D Flow Area; and between river reaches. HEC-RAS allows up to ten different pump groups at a pump station, and each pump group can have up to ten identical pumps. Each pump can have its own on and off trigger elevation. To learn how to connect a pump, enter pump data, and use pump override rules, please review the section on pumps in Chapter 5 of this user's manual.
Pump stations can be used for many purposes, such as pumping water stored behind a levee (interior sump) into the main river. An example schematic of an interior ponding area behind a levee is shown in Figure 14-24. Note that the pump is connected from the storage area to a river station at the downstream end of the levee.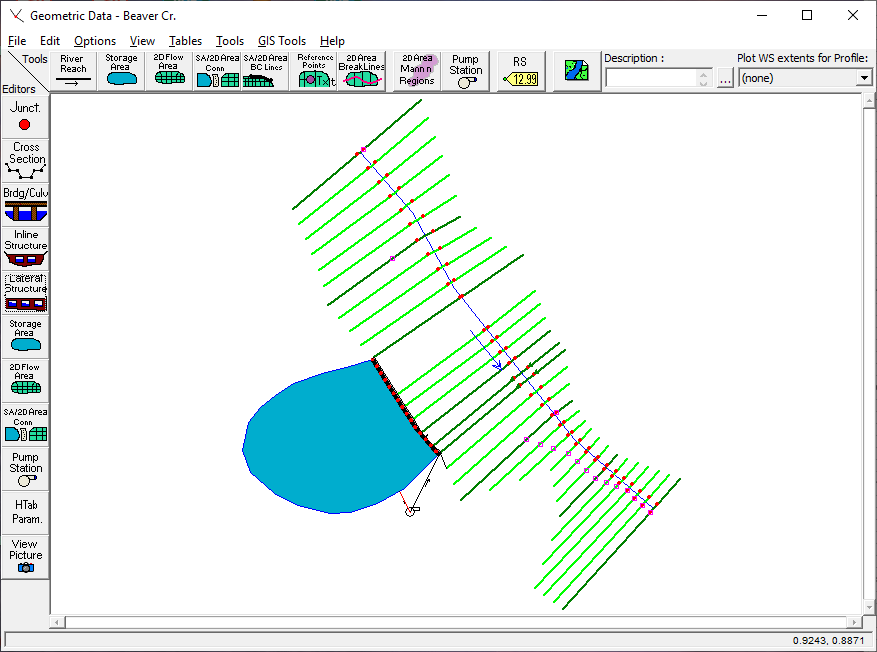
Figure 14 24. Example Pumping Station for Interior Ponding Area
In the example shown in Figure 14-24, a lateral structure was entered to represent the levee. This structure has a gravity draining culvert with a flap gate. The flap gate only allows water to drain from the storage area to the river. Additionally, a pump station is included to pump flows over the levee during a rainfall event. The pump station was drawn by selecting the Pump Station tool, then drawing a connection from the storage area to the cross section at river station 5.39.
In this example, there is a hydrograph attached to the upstream end of the river reach, which represents the incoming flood wave to this reach. There is also a lateral inflow hydrograph attached to the storage area, which represents the local runoff collecting behind the levee. The pumps are used to pump water from the storage area, over the levee, to the river. The top of the levee is at elevation 220 feet. Therefore, the pump station is constantly pumping to a head of 220 feet. The Pump station data editor is shown in Figure 14-25.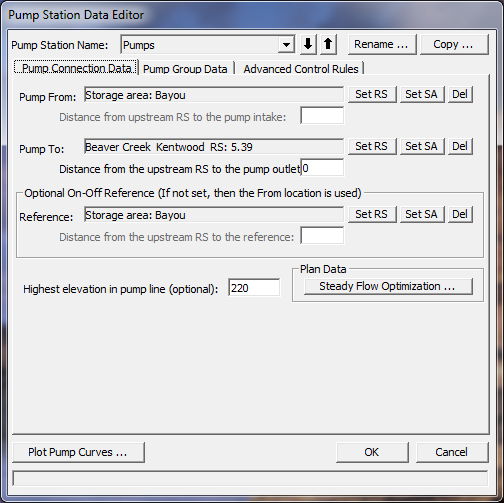
Figure 14 25. Pump Station Data Editor with Example Data
The second tab on the editor brings up the Pump Group Data (Figure 14-26). As shown is Figure 14-26, there is one pump group with three identical pumps (pumps are the same size and flow capacity). However, each of the pumps has a different on and off trigger elevation. The pump efficiency curve is used for all three of the pumps. 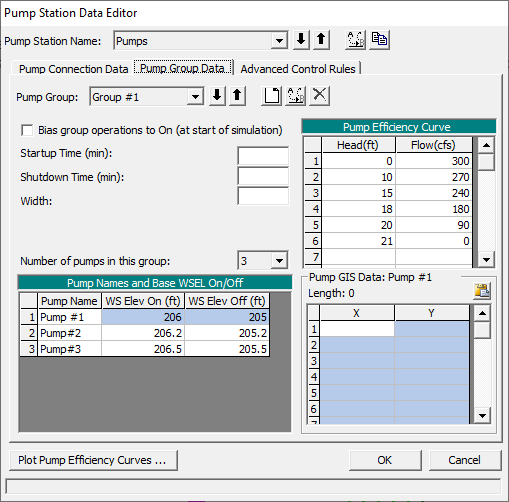
Figure 14 26. Pump Group Data on Pump Editor.
The third tab, Advanced Control Rules, allows the user to enter rules to override the normal pump station operations. When this tab is selected a window will appear as shown in Figure 14-27.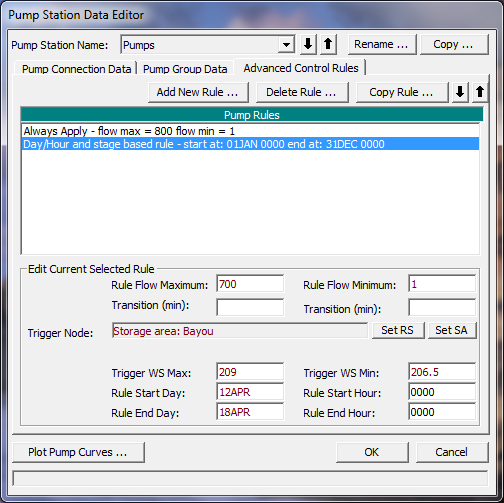
Figure 14 27. Advanced Control Rules editor for Pump Station.
A shown in Figure 14-27, two rules have been applied to this pump station. The first rule sets an absolute maximum pump flow of 800 cfs and a minimum of 1cfs for the entire pump station. This rule will always be applied. The second rule sets a maximum flow of 700 cfs to be applied only between 12 April 0000 and 24 April 0000, but only if the water surface at storage area Bayou is greater than 209. Also, the second part of this rule sets a minimum flow for the same time period, but only if the stage at storage area Bayou is less than 206.5. Details of how to use the rules can be found in chapter 6, under the section on Pumps.
After the computations are performed, the user can view output for the pump station by selecting the stage and flow plotter, then selecting Pump Stations from the Type menu at the top of the window. An example stage and flow plot for the pump station is shown in Figure 14-28. As shown in the figure, the stage for the tailwater location (Stage TW) is a constant 220 ft. This is due to the fact that the pump is constantly pumping over the levee at elevation 220. The stage at the headwater location (stage HW) is the water surface elevations in the storage area. The storage area elevation starts out at an elevation of 205 ft., goes up to around 206.6, and then back down to around 205.1. The flow through the pumps was zero until an elevation of 206 was reached within the storage area, which triggered the first pump. The second pump turned on when the storage area got to elevation 206.2, and the third at elevation 206.5. On the falling side of the hydrograph the pumps began to turn off as the stage went down in the storage area. Shown in Figure 14-29 are the stage and net inflow to the storage area. The net inflow represents all the inflows minus the outflows at each time step. 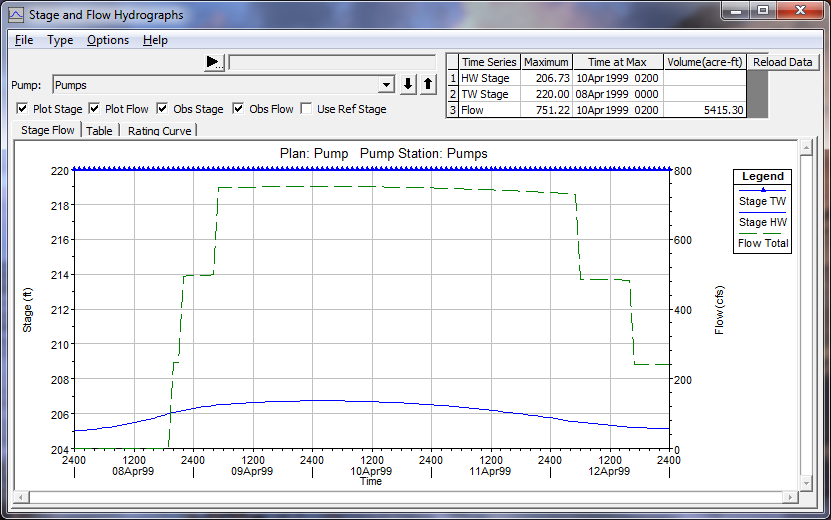
Figure 14 28. Stage and Flow Hydrographs for Pump Station
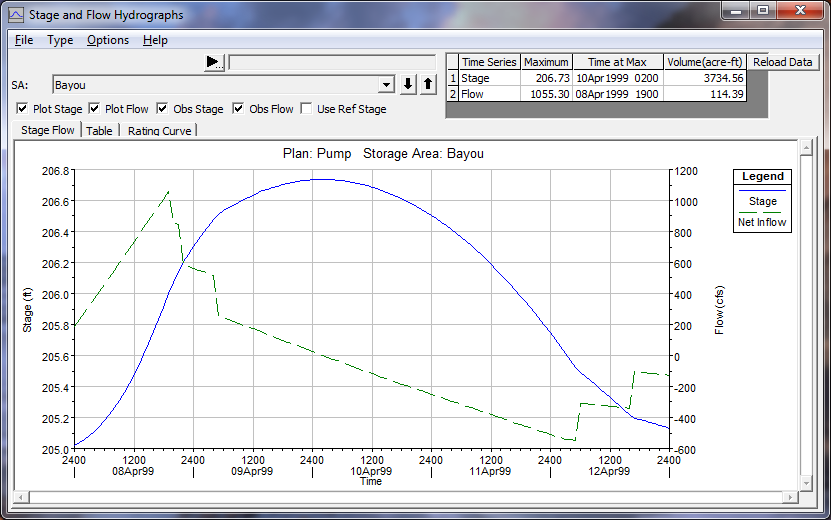
Figure 14 29. Stage and Flow Hydrographs for the Storage Area