Download PDF
Download page Cross Section Data.
Cross Section Data
After the river system schematic is completed, the next step for the modeler is to enter the cross section data. Cross section data represent the geometric boundary of the stream. An accurate representation of the stream channel and the overbank area (floodplain) are absolutely necessary to create an accurate hydraulics model. Cross sections are located at relatively short intervals along the stream to characterize the flow carrying capacity of the stream channel and its adjacent floodplain. Cross sections are required at representative locations throughout the stream and at locations where changes occur in discharge, slope, shape, roughness, at locations where levees begin and end, at hydraulic structures (bridges, culverts, inline weirs/spillways, and lateral weirs/spillways), and closely spaced around stream junctions. Cross sections can be entered by hand in the Geometric editor, or they can be extracted from terrain data from RAS Mapper.
Entering Data
![]()
To enter cross section data directly in the Geometric Data editor, the user presses the Cross Section button on the Geometric Data window. Once the cross section button is pressed, the Cross Section Data Editor will appear as shown in the figure below (Except yours will be blank until you have added some data). To add a cross section to the model, the user must do the following:
- From the Cross Section Editor, select the river and the reach that you would like to place the cross section in. This is accomplished by pressing the down arrow on the River and Reach boxes, and then selecting the river and reach of choice.
- Go to the Options menu and select Add a new Cross Section from the list. An input box will appear prompting you to enter a river station identifier for the new cross section.
- Enter all of the required data for the new cross section. Required data is the data that is openly displayed in the cross section editor window.
- Enter any desired optional information (i.e., ineffective flow areas, levees, blocked obstructions, etc.). Optional cross section information is found under the Options menu.
- Press the Apply Data button in order for the interface to accept the data. The apply data button does not save the data to the hard disk, it is used as a mechanism for telling the interface to use the information that was just entered. If you want the data to be saved to the hard disk you must do that from the File menu on the geometric data window.
The required information for a cross section consists of: the river, reach and river station identifiers; a description; X & Y coordinates (station and elevation points); downstream reach lengths; Manning's roughness coefficients; main channel bank stations; and contraction and expansion coefficients. All of the required information is displayed openly on the Cross Section Data editor (Figure 5-2). A description of this information follows: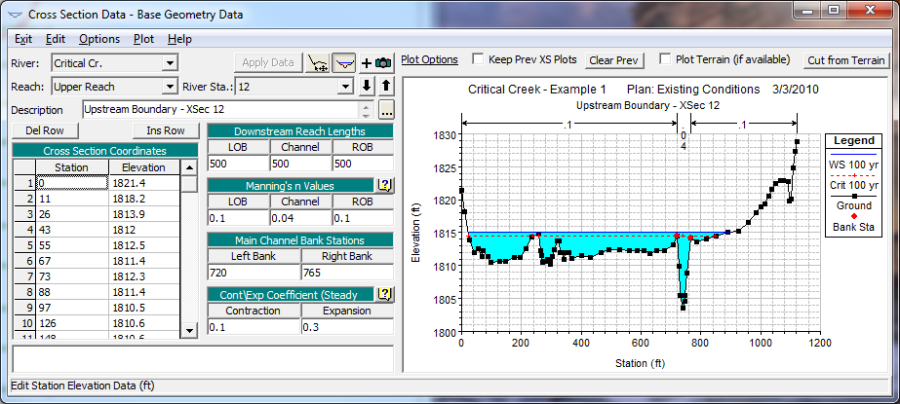
Cross Section Data Editor
Cross section data entered in the manner described above is not geo-referenced (Does not have any horizontal coordinates describing its spatial location on the earth). If you want to have a model that is georeferenced, currently you must develop your model schematic and object layout using HEC-GeoRAS and ArcGIS. Future versions of HEC-RAS will allow you to do this directly inside of HEC-RAS using RAS Mapper.
River, Reach, and River Station. The River and Reach boxes allow the user to select a specific hydraulic reach from the available reaches in the schematic diagram. The river and reach labels define which reach the cross section will be located in. The River Station tag defines where the cross section will be located within the specified reach. The river station tag does not have to be the actual river station of the cross section, but it must be a numeric value. Cross sections are ordered in the reach from highest river station upstream to lowest river station downstream. The up and down arrow buttons next to the river station box can be used to sequentially move through the river stations.
Description. The description box is used to describe the cross section location in more detail than just the river, reach, and river station. This box has a limit of 512 characters. The first line of information is displayed, unless the button to the right of the box is pressed. Also, the first 40 characters of the description can be used as a label for cross section plots and tables.
Cross Section Coordinates. This table is used to enter the station and elevation information of the cross section. Station and elevation information is entered in feet (meters for metric). Cross section stationing must be in increasing order. However, two or more stations can have the same value to represent vertical walls.
Downstream Reach Lengths. The downstream cross section reach lengths describe the distance between the current cross section and the next cross section downstream. Cross section reach lengths are defined for the left overbank, main channel, and the right overbank. Cross section reach lengths are entered in feet (meters for metric).
Manning's n Values. At a minimum, the user must specify Manning's n values for the left overbank, main channel, and the right overbank. Alternative roughness options are available from the Options menu, in which you can have horizontally varying Manning's n values (up to 20 across each cross section) and vertically varying Manning's n values.
Main Channel Bank Stations. The main channel bank stations are used to define what portion of the cross section is considered the main channel and what is considered left and right overbank area. The bank stations must correspond to stations entered on the cross section X & Y coordinates table. If the user enters a value that does not correspond to the station points of the cross section, the interface will ask the user if they would like the value to be automatically interpolated and added to the cross section data.
Contraction & Expansion Coefficients (Steady Flow). Contraction and expansion coefficients are use to evaluate the amount of energy loss that occurs because of a flow contraction or expansion. The coefficients are multiplied by the change in velocity head from the current cross section to the next downstream cross section. In other words, the values entered at a particular cross section are used to compute losses that occur between that cross section and the next downstream cross section. Values entered at this location are used for steady flow hydraulic computations only. Values for Unsteady Flow modeling can be entered from the Tables menu of the Geometric data editor.
Once all of the required data for the cross section are entered, make sure you press the Apply data button to ensure that the interface accepts the data that was just entered.
![]() Plotting the Cross Section. A display of the cross section can be seen directly from the cross section editor. Simply press the cross section plot button at the top of the editor to either display or un-display the cross section graphic.
Plotting the Cross Section. A display of the cross section can be seen directly from the cross section editor. Simply press the cross section plot button at the top of the editor to either display or un-display the cross section graphic.
![]() Attaching and Viewing Pictures at Cross Sections. To attach or view a previously attached picture to a cross section, press the picture button at the upper right hand side of the cross section editor. When this button is pressed, the picture viewer will pop up. You can attach a photo to a location, delete a picture, and view a currently attached photo.
Attaching and Viewing Pictures at Cross Sections. To attach or view a previously attached picture to a cross section, press the picture button at the upper right hand side of the cross section editor. When this button is pressed, the picture viewer will pop up. You can attach a photo to a location, delete a picture, and view a currently attached photo.
Graphical Cross Section Editing. To jump to the Graphical Cross Section editor, press the button just to the right of the Apply Data button. ![]() This will bring up the current cross section in the Graphical Cross Section editor, and allow you to graphically edit it. To learn more about Graphical Cross Section editing, view the section called "Graphical Cross Section Editing" under the Geometric Data Tools section of this manual.
This will bring up the current cross section in the Graphical Cross Section editor, and allow you to graphically edit it. To learn more about Graphical Cross Section editing, view the section called "Graphical Cross Section Editing" under the Geometric Data Tools section of this manual.
Editing Data
The bulk of the cross section data is the station and elevation information. There are several features available under the Edit menu to assist the user in modifying this information. These features include the following:
Undo Editing. This editing feature applies to all of the information on the cross section data editor. Once data has been entered and the Apply Data button has been pressed, the Undo Editing feature is activated. If any changes are made from this point, the user can get the original information back by selecting the Undo Edit option from the Edit menu. Once the Apply Data button is pressed, the new information is considered good and the Undo Edit feature is reset to the new data.
Cut, Copy, and Paste. Cut, Copy, and Paste features are available for the station and elevation information on the cross section editor. These features allow the user to pass cross section station and elevation data to and from the Windows Clipboard. To use this feature, first highlight a cell or multiple cells on the station and elevation table. Cells are highlighted by pressing down on the left mouse button and moving it over the cells that you would like to be highlighted. Next select either the Cut or Copy feature from the Edit menu. If Cut is selected, the information is placed in the Windows Clipboard and then it is deleted from the table. If Copy is selected, the information is placed in the Windows Clipboard, but it also remains in the table. Once the information is in the Windows Clipboard it can be pasted into the station and elevation table of any cross section. To paste data into another cross section, first go to the cross section in which you would like the data to be placed. Highlight the area of the table in which you want the data to be placed. Then select the Paste option from the Edit menu. The cut, copy, and paste features can also be used to pass station and elevation information between HEC-RAS and other programs.
Delete. This option allows the user to delete a single cell or multiple cells in the station/elevation table. Once the cells are deleted, everything below those cells is automatically moved up. To use this option, first highlight the cells that you would like to delete, then select the Delete option from the Edit menu. If you would like to clear cells, without moving the data below those cells, simply highlight the cells and press the delete key.
Insert. This option allows the user to insert one or several rows in the middle of existing data in the station/elevation table. To use this option, first highlight the area in the table that you would like to be inserted. Then select Insert from the Edit menu. The rows will be inserted and all of the data will be moved down the appropriate number of rows. The user can also insert a single row by placing the curser in the row just below where you would like the new row to be inserted. Then select Insert from the Edit menu. The row will be inserted and all of the data below the current row will be moved down one row.
Options
Information that is not required, but is optional, is available from the Options menu at the top of the cross section data editor window (Figure 5-2). Options consist of the following:
Add a new Cross Section. This option initiates the process of adding a cross section to the data set. The user is prompted to enter a river station tag for the new cross section. The river station tag locates the cross section within the selected reach. Once the river station is entered, the cross section data editor is cleared (except for some default values that get set) and the user can begin entering the data for the cross section. Whenever a new cross section is added to the data set, default values will appear for the contraction and expansion coefficients (0.1 and 0.3 respectively). Also, if the new cross section is not the first or most upstream cross section of the reach, the program will set default Manning's n values equal to the n values of the cross section just upstream of the new cross section. If the user does not want these default values, they can simply change them to whatever values they would like.
Copy Current Cross Section. This option allows the user to make a copy of the cross section that is currently displayed in the editor. When this option is selected, the user is prompted to select a river and reach for the new section, and then enter the river station. Once the information is entered, the new cross section is displayed in the editor. At this point it is up to the user to change the description and any other information about the cross section. This option is normally used to make interpolated cross sections between two surveyed cross sections. Once the section is copied, the user can adjust the elevations and stationing of the cross section to adequately depict the geometry between the two surveyed sections.
Rename River Station. This option allows the user to change the River Station of the currently displayed cross section.
Delete Cross Section. This option will delete the currently displayed cross section. The user is prompted with a message stating specifically which cross section is going to be deleted, and requesting the user to press the OK button or the Cancel button. Once the OK button is pressed, the user will be prompted with a question of whether or not they would like the cross section reach lengths to be automatically adjusted to account for the removal of the cross section. If the user answers YES then the reach lengths of the current cross section, that is being deleted, will be added to the reach lengths of the next upstream cross section. If the user answers NO, then the cross section will be deleted with out adjusting any reach lengths.
Adjust Elevations. This option allows the user to adjust all of the elevations of the currently displayed cross section. Positive or negative elevation changes can be entered. Once the value is entered, the interface automatically adjusts all the elevations in the table.
Adjust Stations. This option allows the user to adjust the stationing of the currently displayed cross section. Two options are available. The first option (Multiply by a Factor) allows the user to separately expand and/or contract the left overbank, main channel, and the right overbank. When this option is selected, the user is prompted to enter a multiplier for each of the three flow elements (left overbank, main channel, and right overbank). If the multiplier is less than one, the flow element is contracted. If the multiplier is greater than one, the flow element is expanded. Once the information is entered, and the user hits the OK button, the interface automatically performs the contraction and/or expansions. The cross section should be reviewed to ensure that the desired adjustments were performed. The second option (Add a Constant) allows the user to add or subtract a constant value from all the stations in the cross section. This would allow the entire cross section to be shifted to the right or the left.
Adjust n or k Values. This option allows the user to either increase or decrease all the n or k values of the current cross section. The user is prompted for a single value. This value is then used as the multiplier for all of the n or k values of the current cross section.
Skew Cross Section. This option allows the user to adjust the stationing of a cross section based on a user entered skew angle. Cross-sections are supposed to be taken perpendicular to the flow lines. This may not always be the case, such as at bridges. In order for the program to use the correct flow area, the cross section stationing must be adjusted by taking the cosine of the skew angle times the stationing. When this option is selected, a window will appear allowing the user to enter a skew angle. Once the angle is entered, the software will automatically adjust the cross section stationing. The user can get back to the original stationing by putting a zero skew into the field.
Ineffective Flow Areas. This option allows the user to define areas of the cross section that will contain water that is not actively being conveyed (ineffective flow). Ineffective flow areas are often used to describe portions of a cross section in which water will pond, but the velocity of that water, in the downstream direction, is close to or equal to zero. This water is included in the storage calculations and other wetted cross section parameters, but it is not included as part of the active flow area. When using ineffective flow areas, no additional wetted perimeter is added to the active flow area. An example of an ineffective flow area is shown in Figure 6.3. The cross-hatched area on the left of the plot represents the ineffective flow area.
Two alternatives are available for setting ineffective flow areas. The first option allows the user to define a left station and elevation and a right station and elevation (normal ineffective areas). When this option is used, and if the water surface is below the established ineffective elevations, the areas to the left of the left station and to the right of the right station are considered ineffective. Once the water surface goes above either of the established elevations, then that specific area is no longer considered ineffective. In other words, the program now assumes that the area will be conveying water in the downstream direction, such that it now uses that area in the conveyance calculations of the active flow area. However, the user has the option to set the ineffective flow areas to permanent, which will prevent them from turning off. When this option is used, water is allowed to go over top of the ineffective flow area.
The second option allows for the establishment of blocked ineffective flow areas. Blocked ineffective flow areas require the user to enter an elevation, a left station, and a right station for each ineffective block. Up to ten blocked ineffective flow areas can be entered at each cross section. Once the water surface goes above the elevation of the blocked ineffective flow area, the blocked area is no longer considered ineffective. However, the user has the option to set the blocked ineffective flow areas to permanent, which will prevent them from turning off. When this option is used, water is allowed to go over top of the ineffective flow area.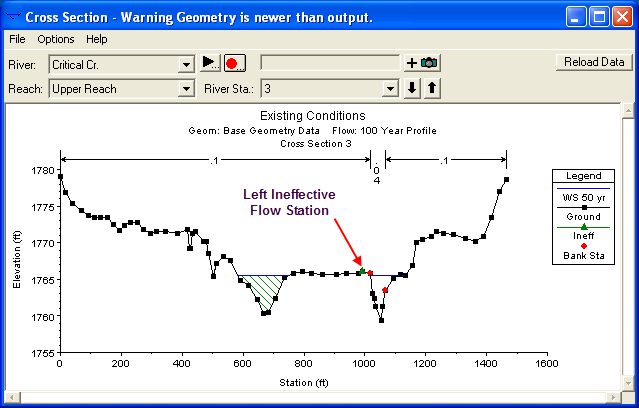
Figure 5 3 Cross section with ineffective flow areas
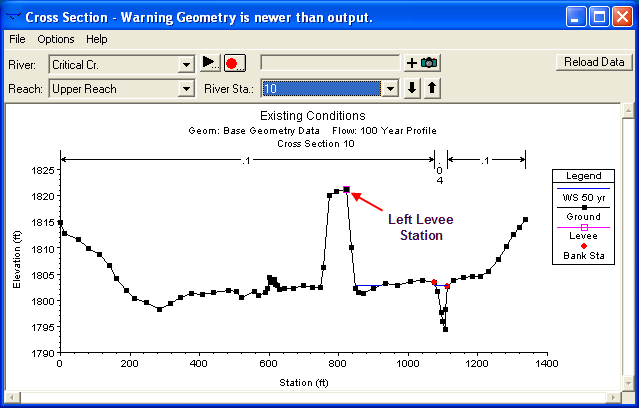
Levees. This option allows the user to establish a left and/or right stationing and elevation on any cross section, in which the water surface will be confined to inside of these stationing values, until the water surface goes above their trigger elevation (elevation at which this option turns off). When levees are established, no water can go to the left of the left levee station or to the right of the right levee station until either of the levee elevations is exceeded. Levee stations must be defined explicitly, or the program assumes that water can go anywhere within the cross section. An example of a cross section with a levee on the left side is shown in the figure below. In this example the levee station and elevation is associated with an existing point on the cross section.
Example of the Levee Option
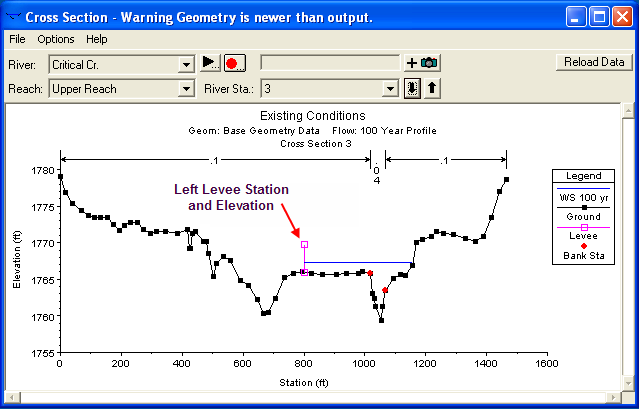
The user may want to add levees into a data set in order to see what effect a levee will have on the water surface. A simple way to do this is to set a levee station and elevation that is above the existing ground. If a levee elevation is placed above the existing geometry of the cross section, then a vertical wall is placed at that station up to the established levee height. Additional wetted perimeter is included when water comes into contact with the levee wall. An example of this is shown below.
Example Levee Added to a Cross Section
Obstructions. This option allows the user to define areas of the cross section that will be permanently blocked out. Obstructions decrease flow area and add wetted perimeter when the water comes in contact with the obstruction. An obstruction does not prevent water from going outside of the obstruction.
Two alternatives are available for entering obstructions. The first option allows the user to define a left station and elevation and a right station and elevation (normal obstructions). When this option is used, the area to the left of the left station and to the right of the right station will be completely blocked out. An example of this type of obstruction is shown in the figure below. 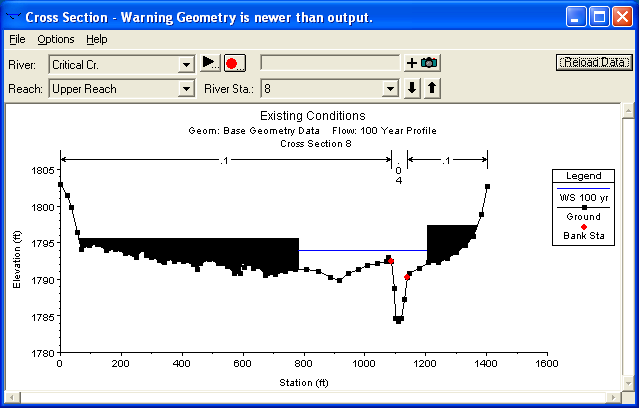
Example of Normal Obstructions
The second option, for obstructions, allows the user to enter up to 20 individual blocks (blocked obstructions). With this option the user enters a left station, a right station, and an elevation for each of the blocks. An example of a cross section with blocked obstructions is shown below.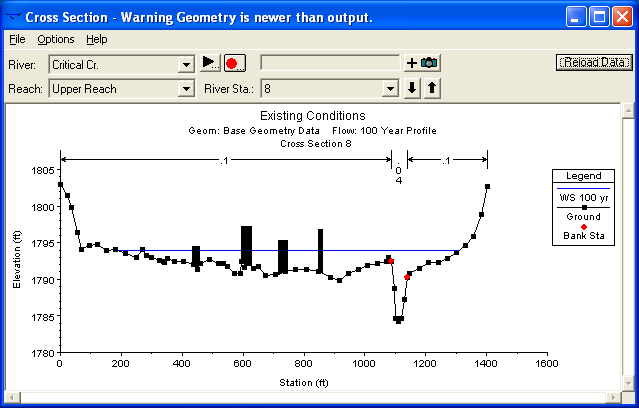
Example of a Cross Section with Blocked Obstruction
Add a Lid to XS. This option allows the user to add a lid (similar to a bridge deck/roadway) to any cross section. This is commonly used when trying to model a long tunnel. The ground geometry can be used to describe the bottom half of the tunnel, while the lid can describe the top half. A lid can be added to any number of cross sections in a row. The program treats cross sections with lids just like any other cross section. The energy equation is used to balance a water surface, with the assumption of open channel flow. The only difference is that the program will subtract out area and add wetted perimeter when the water surface comes into contact with the lid. For unsteady flow models, there is a check box to select the Preissmann Slot option when solving the unsteady flow equations for cross sections with lids. This option allows the unsteady flow equations to solve for a pressure flow water surface using the open channel flow equations.
Add Ice Cover. This option allows the user to enter ice cover for the currently opened cross section. For a detailed discussion of ice cover, and ice modeling, please review the section called Modeling Ice Cover later in this chapter.
Add a Rating Curve. This option allows the user to add a rating curve to a cross section as an alternative to the program computing the water surface. The user is required to enter flow versus elevation information for the rating curve. When the program is executed in a steady flow mode, the program will interpolate a water surface elevation from the rating curve for the given flow of a particular profile.
Horizontal Variation in n Values. This option allows the user to enter more than three Manning's n values for the current cross section. When this option is selected, an additional column for n values is added to the cross section coordinates table as shown in the figure below. A Manning's n value must be placed in the first row of the table. This n value is good for all cross section stations until a new n value shows up in the table. The user does not have to enter an n value for every station, only at the locations where the n value is changing. 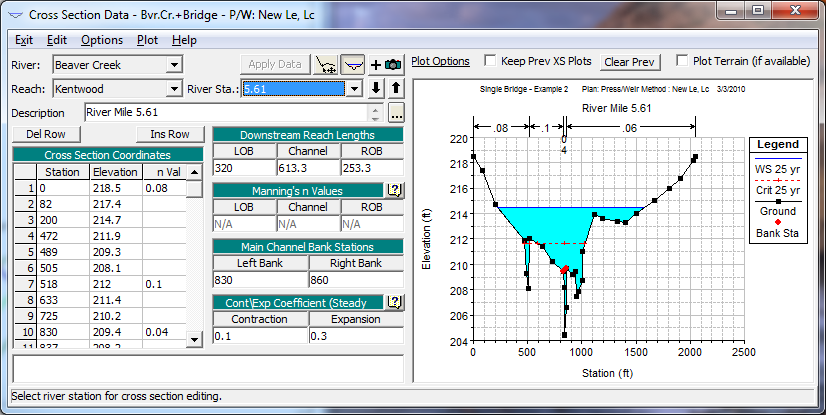
Cross Section with Horizontal Variation of n Values Selected
Horizontal Variation in k Values. This option allows the user to enter k values (roughness heights) instead of n values. The k values are entered in the same manner as the horizontal variation of n values. To learn more about k values and how they are used in the program, see Chapter 3 of the Hydraulic Reference manual.
Vertical Variation in n Values. This option allows the user to enter Manning's n values that vary both horizontally as well as vertically. The user can vary the n value either by elevation or by flow. When this option is selected a window will appear as shown the figure below. The user enters the stationing for horizontal changes in n values across the top in row 0 (these stations are entered in the same manner as the horizontal variation of Manning's n value option). The elevations in which changes occur are entered in the first column. Then the actual Manning's n values are entered in rows 1-20 (columns 2-21). The program will interpolate Manning's n values whenever the actual water surface is between the entered elevations. If the water surface is below the first elevation entered, then the values from that elevation will be used. Likewise, if the water surface is above the last elevation entered, the program will use the n values from the last elevation specified. No extrapolation is done on either side of the user entered values.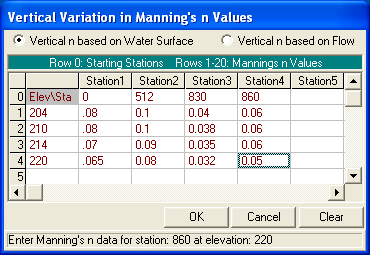
Vertical Variation of Manning's n Values Window
Plotting
Once all the data have been entered for a cross section, you should plot the cross section to inspect it for possible data errors. To plot the current cross section from the cross section editor, you can either select Plot Cross Section from the Plot menu (this will bring up a separate plot window), or you can use the cross section plot button at the top of the cross section editor (this attaches a plot window to the cross section editor).