Download PDF
Download page Georeferencing an HEC-RAS Model.
Georeferencing an HEC-RAS Model
Georeferencing is the process by which real-world coordinates are assigned to an HEC-RAS model to reference it to other data. An HEC-RAS model that shares a common coordinate system with GIS layers allows the developer of the model to visualize limits of the defined study area using background data.
The use of aerial photographs, for example, can be extremely beneficial for identifying the location of a landform such as levee or road or structures such as bridges and weirs while showing the user it's representation in the hydraulic model. Therefore, background data is quite useful for model development. HEC-RAS results may also be quickly visualized using automated GIS procedures using tools such as HEC-RAS Mapper and HEC-GeoRAS. Additionally, floodplain maps may also be developed if the HEC-RAS model is georeferenced.
HEC-RAS allows the user to have a stream system schematic, and hydraulic elements, that is drawn spatially correct. This requires that the stream centerlines, cross sections, storage areas, and 2D Flow Areas have GIS coordinate information in order to draw them in a georeferenced framework. Generally, GIS coordinate information can be developed by laying out the model geospatially using HEC-RAS Mapper. However, HEC-RAS also has editors and tools for allowing the user to enter and manipulate GIS coordinate information directly in the HEC-RAS Geometric Data editor. The following is a list of the GIS tools available from the GIS Tools menu at the top of the Geometric Data editor.
GIS Tools in HEC-RAS
GIS tools in HEC-RAS are provided on the Geometric Data editor on the GIS Tools menu shown in Figure 5-96. The GIS Tools provide capabilities for editing and modifying x and y coordinates associated with the river network, cross sections, and other features in HEC-RAS. These GIS coordinate data can be edited directly through the different table options or computed based on the data available. The GIS Tools also provide visual displays of the data that can be exported to the GIS for processing.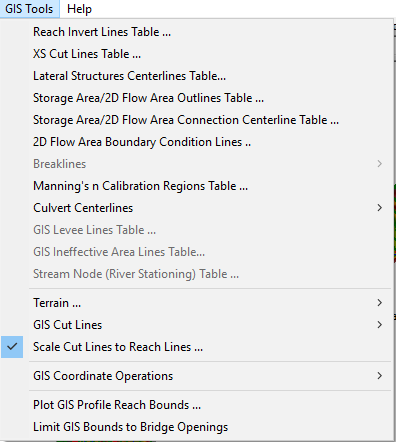
Figure 5 96. GIS Tools Menu Options
Tables
The x and y position that establish the location of the river reaches, cross-sectional cut lines, storage area outlines, storage area connections, levee lines, and ineffective areas are available through Tables from the GIS Tools menu. These tables identify the object and provide simple spreadsheet operations including cut, copy, and paste. This allows you easy access to geo-reference an individual object, such as a cross section cut line. The following is a list of the available tables from the GIS Tools menu:
Reach Invert Lines Table: This option allows the user to numerically edit the coordinates of the river reach schematic lines. When the river system schematic is hand drawn on the screen, the coordinates of the river reach lines are put into a simple coordinate system that ranges from 0.0 to 1.0 in both the X and Y direction. However, the user has the option of taking real world coordinates (such as UTM or State Plane coordinates) off of a map and entering them into this table. If the user decides to use real world coordinates, real world coordinates must be added for all of the reaches of the schematic. If this is not done, the schematic will still be displayed in the simple 0.0 to 1.0 coordinate system (the hand drawn coordinates). Once real world coordinates have been entered for all of the river reaches, then the schematic will be drawn in that coordinate system. To enter/edit the reach schematic lines, select the Reach Invert Lines Table option from the GIS Tools menu. Once this option is selected, a window will appear allowing the user to enter/edit the coordinates of any of the reaches defined in the schematic (Figure 5-97).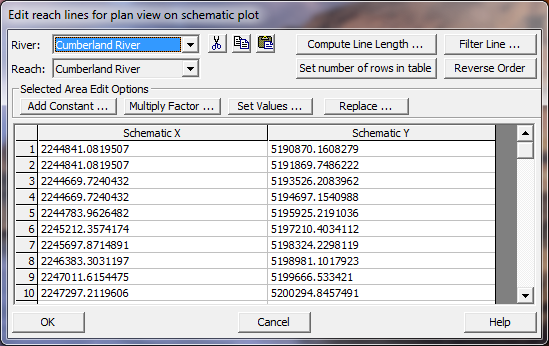
Figure 5 97. GIS coordinates for River/Reach lines
XS Cut Lines Table: This option allows the user to numerically edit the coordinates of the cross section schematic lines. When the river system is hand drawn on the screen, the default coordinate system is a simple 0.0 to 1.0 range for both the X and Y direction. However, the user can add spatially references map layers into the HEC-RAS Geometry editor, to be used as background map layers. If the user adds spatially referenced background map layers, then the coordinate system used will be based on the background maps. As cross sections are entered, they are automatically scaled based on the coordinates of the river reach line and the main channel distance between cross sections. Each cross section is drawn as a straight line perpendicular to the river reach schematic line. The user has the option of entering the real world coordinates (UTM or State Plane) of the cross section schematic lines. Each cross section schematic line must have at least two points, a start and an end, but additional points can be added if the cross section was taken as a multi segmented line. In order for the cross section schematic lines to be plotted in the real world coordinate system, the user must enter real world coordinates for all of the cross sections in the reach. To enter/edit the cross section schematic lines, select the XS Cut Lines Table option from the GIS Tools menu. Once this option is selected, a window will appear allowing the user to enter/edit the coordinates of any of the cross section schematic lines. User's can also use the Measuring Tool feature built into HEC-RAS to digitize the appropriate locations of a cross section. The measure tool is accessed by holding down the Cntrl Key and using the mouse to lay out a line. Once the line is ended, statistics about the line are shown on the screen and the X and Y coordinates of that line are sent to the Windows clipboard. The user can then paste them into the Cross Section Cut Line table if desired.
Lateral Structure Centerline Tables: This table allows user to enter/edit the X and Y coordinates that define the centerline of a Lateral Structure. Users can cut/past coordinates into the table. Additionally X, Y coordinates can be imported from Shapefiles (Import Lines). Also, the number of points in the table can be filtered down to a more manageable number of points using the Filter option.
Storage Area/2D Flow Area Outlines Table: This option allows the user to enter/edit the X and Y coordinates that define the outline of a storage area or a 2D Flow Area. If you are using GIS data, these coordinates may be in the UTM or State Plane coordinate system. If you are not using GIS data, the coordinate system for the storage areas will just be in a 0 to 1.0 system. The coordinates of a storage area can also be edited graphically by using the Move Object option from the edit menu. The button called "Filter Multiple Lines" allows the user to select multiple storage areas and/or 2D Flow Areas, for filtering the number of points in the polygon that describes the storage area or 2D Flow Area. Once the user selects the storage areas and 2D Flow Areas to be filtered, they will be prompted for a point filter tolerance (default is 0.1). This tolerance is a collinear point filtering tolerance. The software puts a line between points 1 and 3, then if point 2 is a distance less that the tolerance away from that line, then it assumes that point two is not needed (i.e. the three points are basically on a straight line), so point to is dropped from the polygon perimeter.
Storage Area/2D Flow Area Connection Centerline Table: This option is used to define the coordinates of the hydraulic structure that is being used to connect two storage areas, or a storage area to a 2D Flow Area, or two 2D Flow Areas. The connection should be drawn from left to right looking in what the user considers to be the positive flow direction. This line will be drawn on the river system schematic, and will represent the hydraulic structure being used to connect two areas.
2D Flow Area Boundary Condition Lines: This option will show the coordinates of any 2D Flow Area external Boundary Condition lines.
Breaklines: This option brings up a table that shows the X and Y coordinates for each of the breaklines. Users can edit the X and Y coordinates directly, they can cut/paste values, and they can import breaklines from Shapefiles.
GIS Levee Lines Table: This option allows the user to edit/enter the coordinates for a user specified levee. Levees can be defined in the GIS system and imported into HEC-RAS. The coordinates will consist of X, Y, and Z (elevation).
Manning's n Calibration Regions Table: This option allows the user to enter/edit the X and Y coordinates that define the outline of the Manning's n Override/Calibration regions polygons.
Culvert Centerlines: There are two options under this menu option. The first is to Import Barrel Centerline from a Shapefile, and the second is to enter/edit the X and Y culvert barrel centerline coordinates.
GIS Ineffective Flow Area Table: This option allows the user to edit/enter the coordinates for a user specified ineffective flow areas. Ineffective flow areas can be defined in the RAS Mapper as a polygon. The coordinates will consist of X, Y, and Z (trigger elevation for when it will be turned off).
GIS Cut Lines
The GIS Cut Lines menu item provides useful tools for quickly computing geospatial information for cross sections. The tools allow to georeference cross sections and to adjust the geospatial length of the cross section to match the width specified by the cross-section's station-elevation data.
Accept Displayed Locations (as Georeferenced). This tool allows the user set the GIS cut line x and y positions to the coordinates displayed in the Geometric data editor. You can do this for several cross sections at a time using this menu option, or you can do this one cross section at a time by using the left mouse button to click on a specific cross section.
Remove Georeferenced Cut Line Data: This option allows user's to select cross sections and then request that all the georeferenced coordinates for those cross sections be removed, and the cross section go back to being laid out as straight lines along the stream centerline. The location of the cross sections will be based on their river stationing and reach lengths between the cross sections.
Adjust Cut Line Lengths to Match XS Lengths. You can adjust the length of the cut line to match the width defined by the cross section's station-elevation data. This tool will invoke the table (Figure 5-98) showing the river station, cut line length, cross section length, and ratio of cut line length to cross section length. You then specify how you would like to adjust the cut line: whether RAS should adjust the left side, right side, or both sides the line equally to make the cut line length equal to the cross section length.
Once you have decided which side to extend or trim, you then choose to adjust the cut line lengths or cross section lengths using the provided buttons.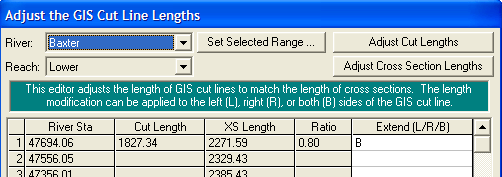
Figure 5 98. Dialog for adjusting cross section and cut line lengths
Extend Cut Lines and Sta/Elev. The menu option to extend the cut line and station elevation data allows you to extend both the cut line and cross section in the left bank or right bank. This is used to extend the cross section to improve floodplain mapping and should only be used once the cross section has reached high ground. The dialog use for extending a cross section is shown in Figure 5-99. 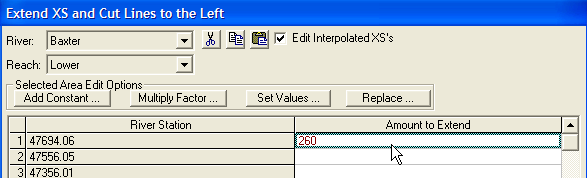
Figure 5 99. Dialog for extending a cut line.
Project XS to Straight Cut Line. This is an option to straighten a cross section based on its first and last point in the XS Cut Line. This option adjusts the Cut Line and the internal station/elevation data to match the new length of the line.
Reverse Cut Lines. This option will reverse the order of the horizontal coordinates of the cross section cut line. Cross sections must be laid out from left to right looking downstream. You can ask HEC-RAS to show you the direction a cross section line was laid out. If the cross section cut line is not laid out from left to right (but the station/elevation data are), you can reverse the cross section cut line with this option. If you need to reverse the order of the cross section cut line and the station/elevation data, there is a separate tool to do that under the Tools menu of the Geometric Data editor.
Scale Cut Lines to Reach Lines
As discussed previously, the cross sections may look georeferenced, but they actually may not be. Cross sections that do not have geospatial information are drawn perpendicular to the stream centerline and the spacing is based on the downstream reach lengths.
By default, the Geometric Schematic scales the display of the cross sections based on the river network. This is handy when the data is not georeferenced (when the river schematic is very short when compared with real world distance), but we want to turn this option off when we georeference the cross sections. Select the GIS Tools | Scale Cut Lines to Reach Lines menu item to turn it on or off, the default is on.
GIS Coordinate Operations
The GIS Coordinate Operations allow you to switch the x an y coordinates; add and multiply the coordinates by a factor; and to filter points in the GIS lines for a few of the objects in HEC-RAS: reaches, cross sections, and storage areas/2D Flow Areas. These tools are useful if you accidentally imported the northing and easting data incorrectly.
Other tools allow you to add and multiple the coordinate values. This is convenient for performing simple coordinate transformations or for removing a false northing or easting. Coordinate manipulation options are shown in Figure 5-100.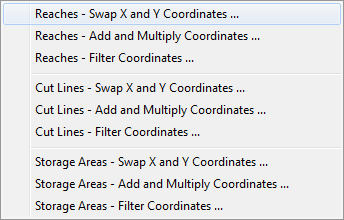
Figure 5 100. Coordinate manipulation menu options.
Plot GIS Profile Reach Bounds
If you intend to perform a floodplain delineation based on the computed HEC-RAS results, you will need to verify what RAS thinks are the limits of the model. You can plot this information using the Plot GIS Profile Reach Bounds menu option for each water surface profile. After selecting this option you will need to choose the profile(s) to plot and river reach(es). The bounds will be plotted in magenta (by default) as illustrated in Figure 5-101.
The GIS Profile Reach Bounds is also referred to as the Bounding Polygon. This data will be used in the GIS to keep the floodplain delineation to occur only over the limits of the hydraulic model.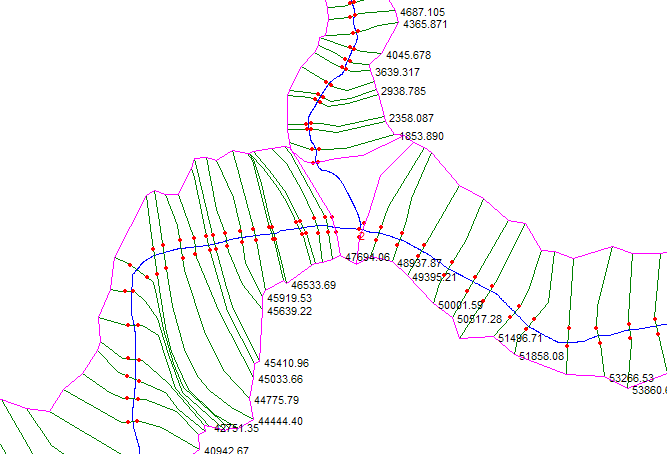
Figure 5 101. GIS bounding polygon information limits floodplain delineation to the area modeled in HEC-RAS
.
Limit GIS Bounds to Bridge Openings. This option will limit the GIS bounding polygon to the inside of a Bridge opening at all bridge locations.