This video provides an overview of the methods in an alpha version of this new tool. We will update the documentation on the 6.2 release version below.
Sediment Rating Curve Challenges and Best Practices
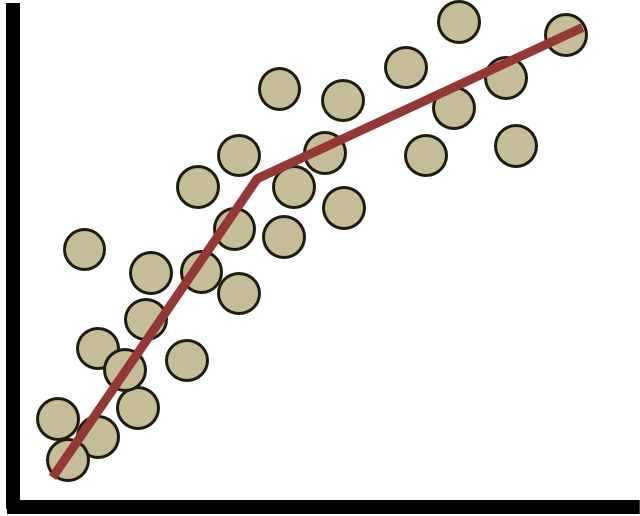
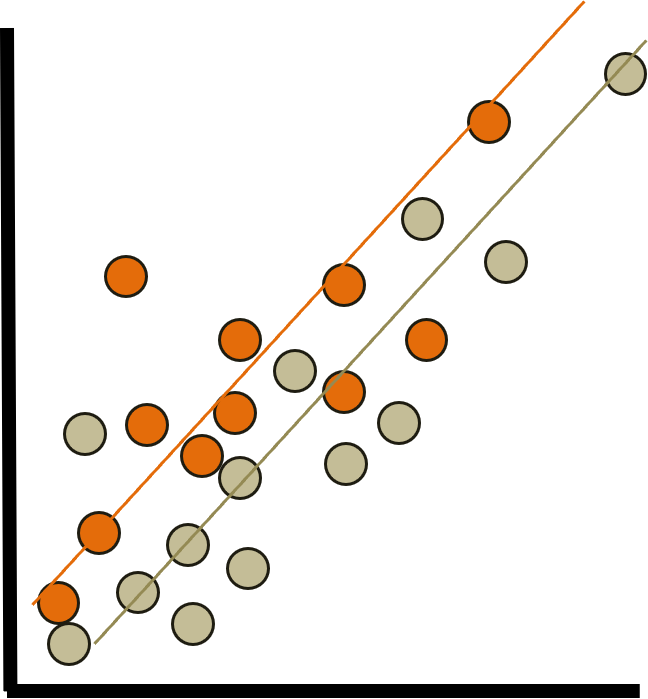
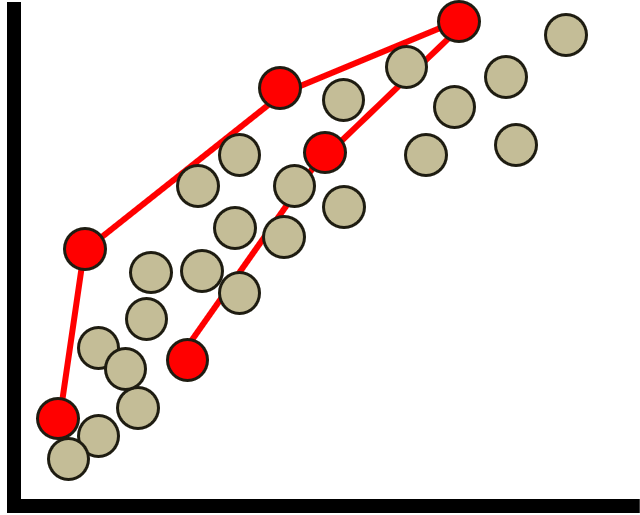
Sediment data are usually noisy. They tend to include a lot of uncertainty and natural variability. But sediment models require modelers to summarize these data into more concrete inputs and trends that the model can use. The two most common data analysis or summary tasks that users encounter include summarizing the flow-load data with a sediment rating curve and
The Sediment Transport User Guide includes an extensive discussion of common data challenges encountered in the process of developing a sediment rating curve and analyses that modelers should do with their data before settling on a sediment relationship for their boundary conditions. These are also summarized in this video:
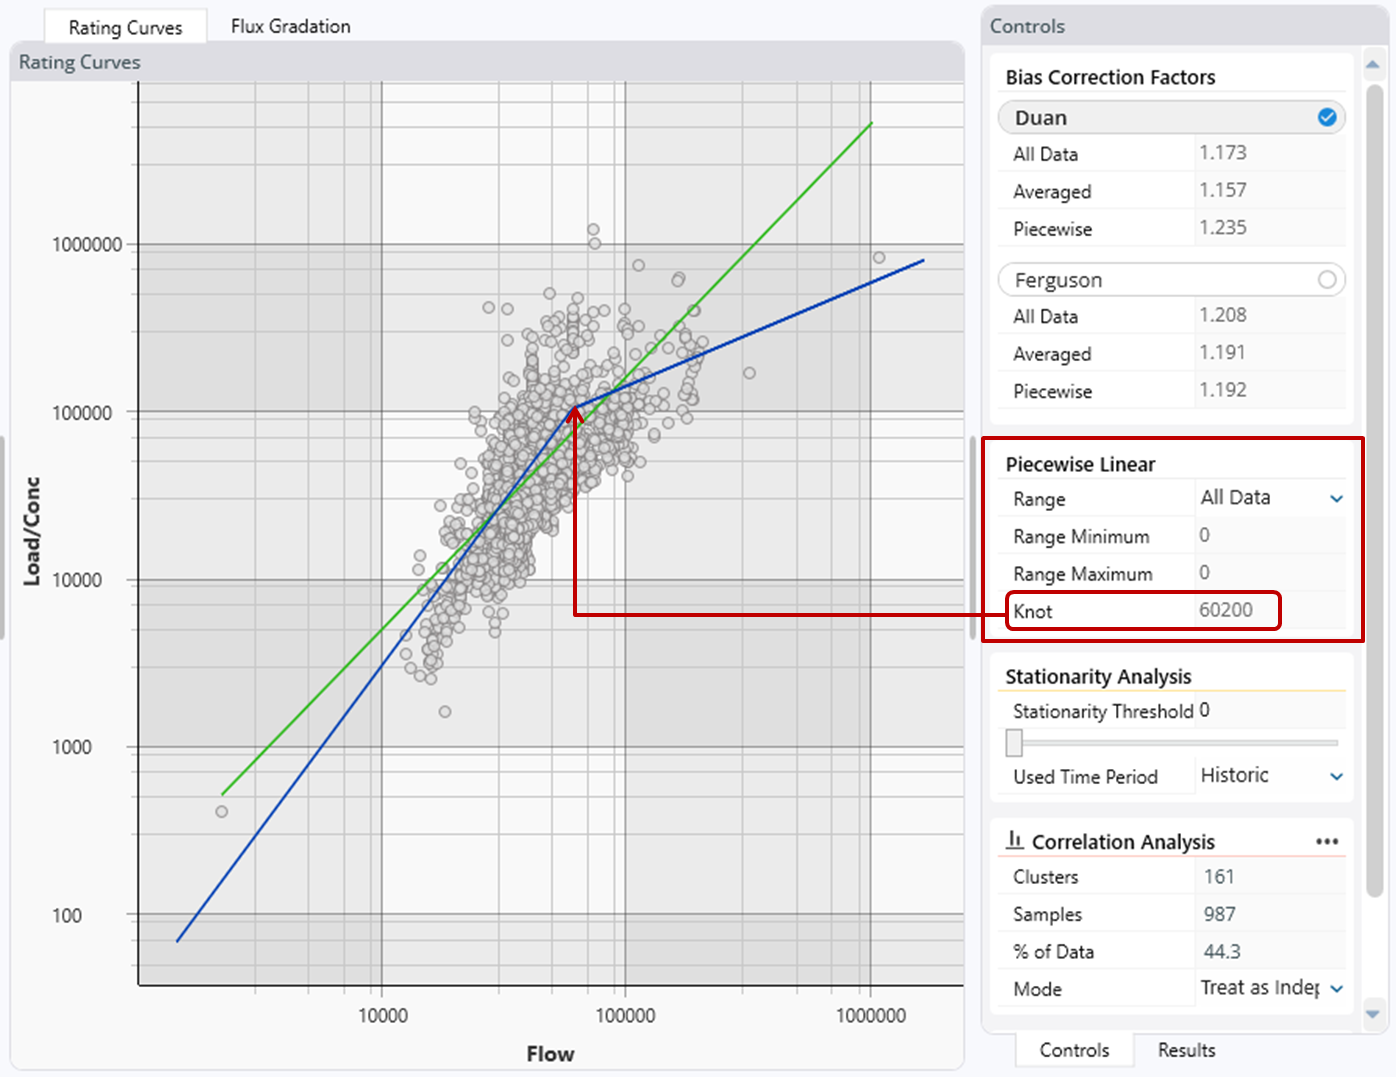
But the latest version of HEC-RAS includes a Sediment Rating Curve Analysis Tool that standardizes these analyses and provides simple tools to help sediment modelers and analysts think carefully about their data and develop quality relationships for model boundaries or sediment budgets. The tool includes the following capabilities: