Download PDF
Download page 1D Unsteady Flow Floodway Encroachment Analysis.
1D Unsteady Flow Floodway Encroachment Analysis
Encroachment analyses can also be performed with the unsteady flow computations module within HEC-RAS in both 1D and 2D. The 1D unsteady approach utilizes similar techniques using the same methods available in steady flow analysis. These same 5 methods are listed below.
- Method 1 -User enters right and left encroachment station
- Method 2 -User enters a fixed top width
- Method 3 -User specifies the percent reduction in conveyance
- Method 4 -User specifies a target water surface increase
- Method 5 -User specifies target water surface increase and maximum change in energy
An additional method for encroachment analysis is available which utilizes Encroachment Regions within RAS Mapper to establish left and right encroachment locations for 1D and 2D unsteady flow modeling.
When performing a floodway encroachment analysis, the base information should be consistent, meaning that the geometry, flow, and plan data should all be identical. Identical data allows for a consistent evaluation of the impacts to the model results given the encroachment information. Therefore, there are some basic guidelines that should be considered.
- The geometry must be the same for both the Base and Encroached plans.
- The flow data must be the same for both the Base and Encroached plans. Normal depth is a good downstream boundary condition as it will account for the change in flow conditions.
- The plan data must be the same for the the Base and Encroached plans.
- The Base plan must be run prior to the Encroachment analysis
Traditional 1D Unsteady Flow Approach
Because unsteady flow models can have significant run times, a 1D steady flow model can be used to inform and assist in performing an unsteady floodway encroachment analysis. A suggested procedure for performing an encroachment analysis with a 1D unsteady flow model is the following:
- Develop the unsteady flow model of the river system and calibrate it to the extent possible.
- Develop an unsteady flow plan of the base flows (100-yr event) in order to establish the base floodplain.
- Create a steady flow plan using the peak flows from the unsteady flow run as the base flow for the model.
- Set up the model for two profiles with the same flows.
- Perform a steady flow encroachment analysis using the available steady flow encroachment methods to calculate the approximate floodway.
- Copy the unsteady flow plan to a new plan (using the Save As option), and give it a name that represents the encroached plan.
- Adjust the boundary conditions file to reflect an increased water surface elevation at the downstream boundary for the range of possible flows. If using a rating curve, you will need to develop a new rating to reflect the encroached condition at the downstream boundary. If you are using normal depth or critical depth, no change is necessary, since the program will calculate a new water surface with the encroachments.
- Go to the Options menu of the unsteady flow analysis window and select Unsteady Encroachments. This will bring up the Unsteady flow Encroachment editor shown below.
- Import the final encroachments from the steady flow encroachment run in to the unsteady flow encroachment editor.
This is accomplished by pressing the button labeled "Get Encroachments from Steady Flow Plan", and then selecting the appropriate plan and profile number from the steady flow encroachment analysis.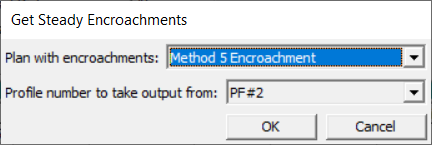
The data will then populate the 1D Encroachment Table Paramaters shown below.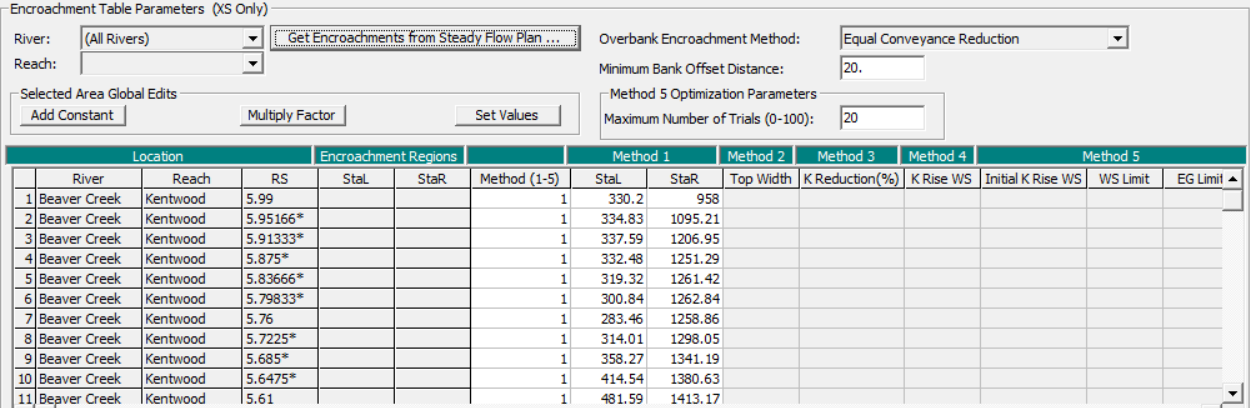
- Select the "Base Plan" for results comparison.
- Run the unsteady flow model with the encroachments and compare the output of the encroached unsteady flow plan with the output from the base unsteady flow plan.
- Adjust the encroachments as necessary to stay within the limits for increased water surface elevations.
- Re-run the unsteady flow model.
- Repeat this process until a final floodway is achieved.
Unsteady Flow Encroachment Table
1D Unsteady flow encroachment analysis provides capability for the 5 traditional methods of analysis as well as integrating Encroachment Regions for limiting the water surface in the floodplain fringe. For 2D unsteady flow encroachment analysis, the Encroachment Regions method is the only procedure available. It is intended that users can perform floodway encroachment analysis on 1D, 2D, or combined 1D/2D models with a mix of encroachment methods. However, it is anticipated that the final runs will be performed using Encroachment Regions.
In the figure below, is the Unsteady Flow Encroachment Editor. Access to the Unsteady Flow Encroachment Editor is available from the Unsteady Flow Analysis window from the Options | Unsteady Encroachment menu item. The Unsteady Flow Encroachment Table allows the user to enter information for all encroachment parameters and methods and choose which method to apply to each cross section. In order to enable the encroachment analysis, select the base plan from the "Base Plan for Encroachments" list.
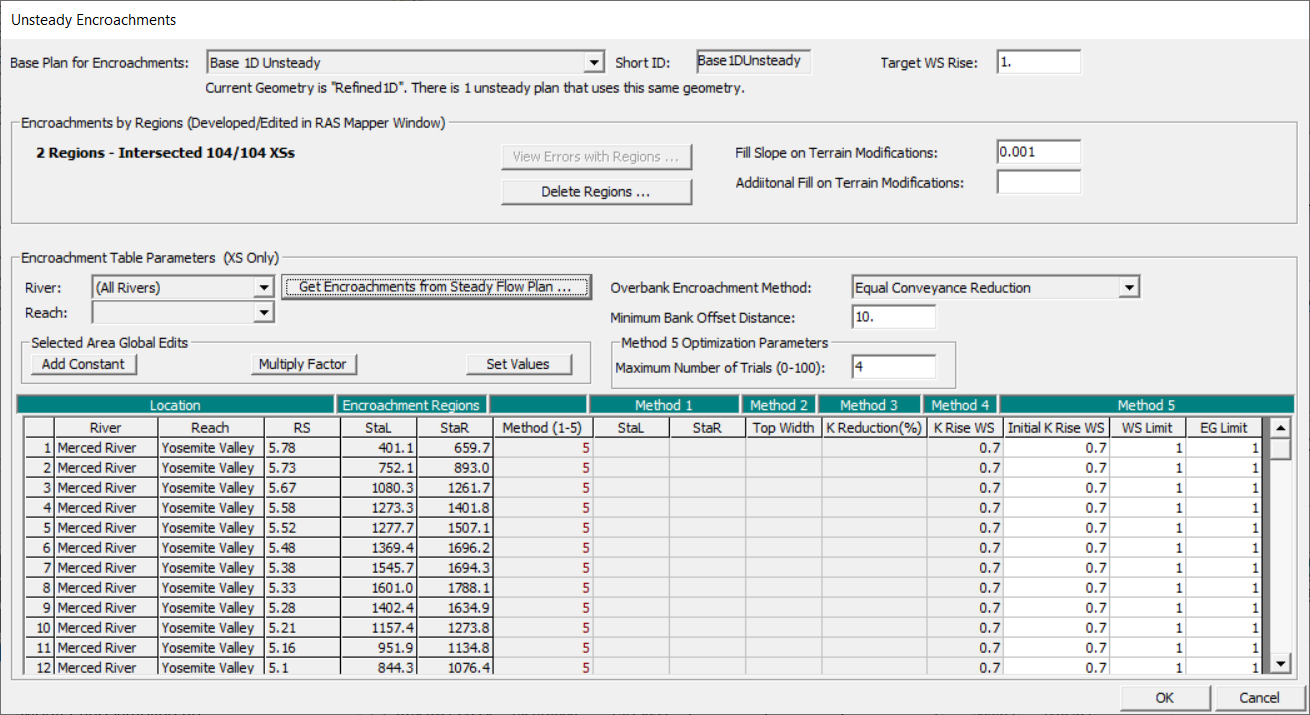
A description of the parameters in the Unsteady Flow Encroachment Editor are described below.
| Parameter | Description |
|---|---|
| Base Plan for Encroachments | Base Plan used for results comparison. Choose the "Disabled - (No Encroachment Analysis)" to not run an encroachment. |
| Target WS Rise | Max allowable water surface rise for the encroached floodway. This value will be used to compute a new RAS Terrain to simulate a filling in of the floodplain at the water surface edge for 1D and 2D unsteady simulations. |
| Encroachment Regions | If Encroachment Regions (polygons) are specified in the Plan data in RAS Mapper, the polygons will be used a eliminate flow up to the specified Target Rise. If there is greater surcharge than the Target Rise it will be evident in the floodplain mapping. |
| Fill Slope on Terrain Modifications | Sloping of fill on the Terrain Modification in the new encroached RAS Terrain layer. The base elevation for the Terrain Modification is based on the Target Rise. |
| Additional Fill on Terrain Modifications | Additional fill height added to the Target Rise for creating the Terrain Modification for the Encroached RAS Terrain. |
| Minimum Bank Offset Distance | Limits the floodway encroachment to within the specified offset of the channel bank stations on 1D cross sections |
| Get Encroachments from Steady Flow Plan | Allows the user to import Left and Right Encroachment Stations at cross sections from a Steady Flow simulation into Method 1 data. |
| Overbank Encroachment Method | The optimization in Method 5 attempts to maintain floodplain equity either by removing conveyance in the left and right overbanks through an (1) Equal Conveyance Reduction (based on the encroached water surface) or by (2) Preserving the Prior Conveyance Ratio (where prior is the base water surface). |
| Number of Trials | Specifies the number of unsteady simulations for Method 5 runs, when attempting to solve for the encroachment. |
| Method 1 through 5 (column) | Data needs specified for the encroachment analysis method. |
| Method (column) | Method used for the specified cross section. |
| Encroachment Regions (column) | If geospatial polygons are specified by the Encroachment Region layer, the Left and Right intersection with the cross section is specified. |
Performing Unsteady Flow Encroachment Analysis
The HEC-RAS encroachment procedure is based on previously calculated natural water surface elevations (base plan). Subsequent simulations utilize the base plan to compare against the encroached results. In general, when performing a floodway encroachment analysis, encroachment Method 4 and Method 5 are normally used to get a first cut at the encroachment stations. Recognizing that the initial floodway computations may provide changes in water surface elevations greater, or less, than the "target" increase, multiple computer trial runs are usually made with several "target" values ("K Rise WS") specified in the Encroachment Data Table.
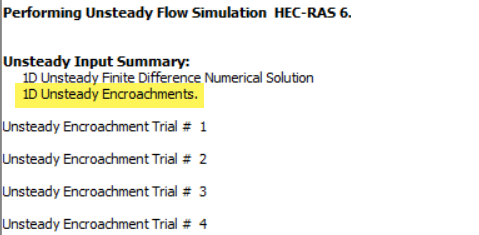
If an encroachment simulation is being run, the Computation Log File will echo that "1D Unsteady Encroachments" were requested. As shown in the figure below, Method 5 was used for the unsteady encroachment analysis with 4 Trials.
After initial trial simulations, the encroachment stations will become more defined. Subsequent encroachment runs may be made using a method that specifically sets the Left and Right encroachment stations which allows the user to refine the floodway encroachment through detailed analysis of changes in the water surface elevations, velocities, and energy. The final encroachment run should be made using a method that specifically sets the Left and Right encroachment stations using Method 1 or Encroachment Polygons.
While the floodway analysis generally focuses on the change in water surface elevation, it is important to remember that the floodway must be consistent with local development plans and provide reasonable hydraulic transitions through the study reach. Sometimes the computed floodway solution, which provides computed water surfaces at or near the target maximum, may be unreasonable in visualizing the mapping results. Visual inspection of the changes in water surface elevations, velocities, energy, and shape of floodway is imperative in the evaluation of the final solution to ensure reasonable floodway results and that the target maximum is not exceeded.
Encroachment Regions
To assist with establishing the floodway, RAS Mapper provides the capability to convert the encroachment stations at cross sections into polygons. The procedure to convert computed encroachment stations to encroachment polygons is enumerated below.
- Open RAS Mapper
- Expand the Plans group and Encroachment Plan
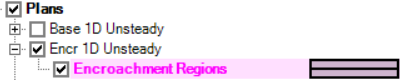
- Select the Encroachment Regions layer
- Start Editing
- Right-click on the Encroachment Regions layer and select the Generate Floodway Encroachment Polygons menu item
- Stop Editing
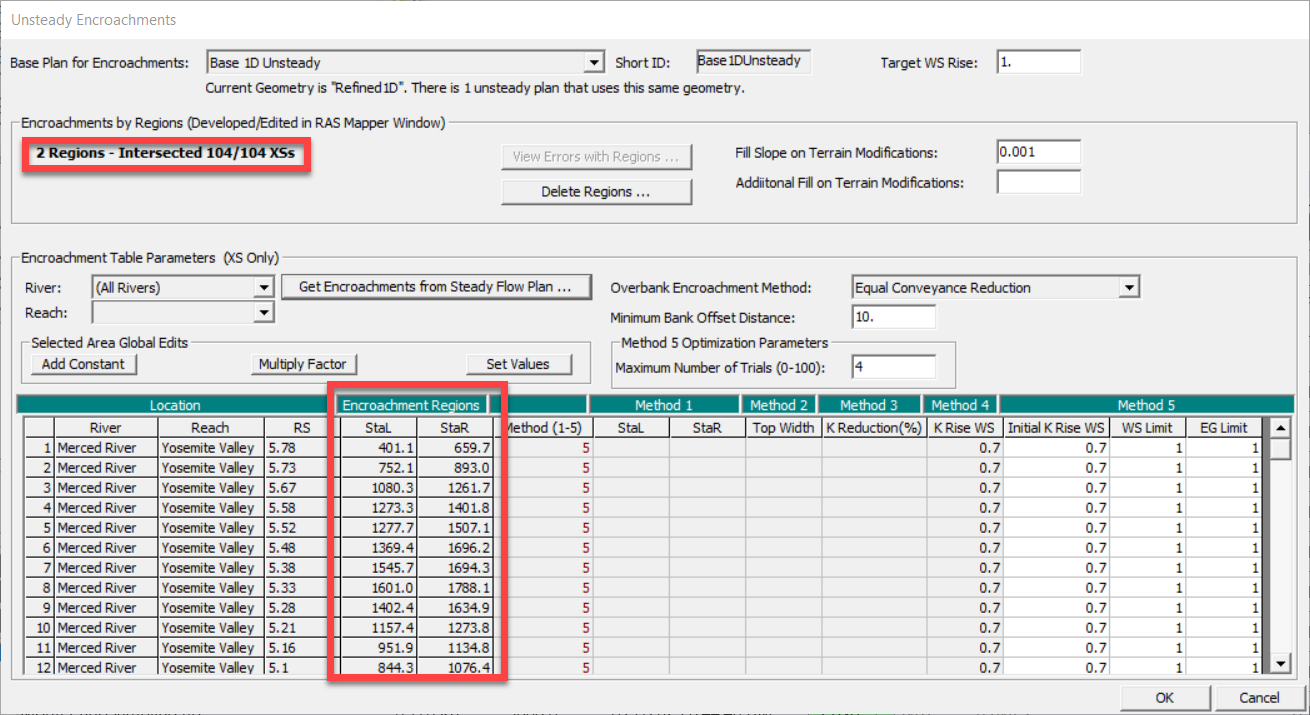
The Unsteady Flow Encroachment Editor will indicate the presence of Encroachment Regions, as shown below. If Encroachment Regions are present at a cross section, the Left and Right Encroachment Station will be used regardless of the method specified in the "Method" column of the data table.
Viewing Floodplain Encroachment Results
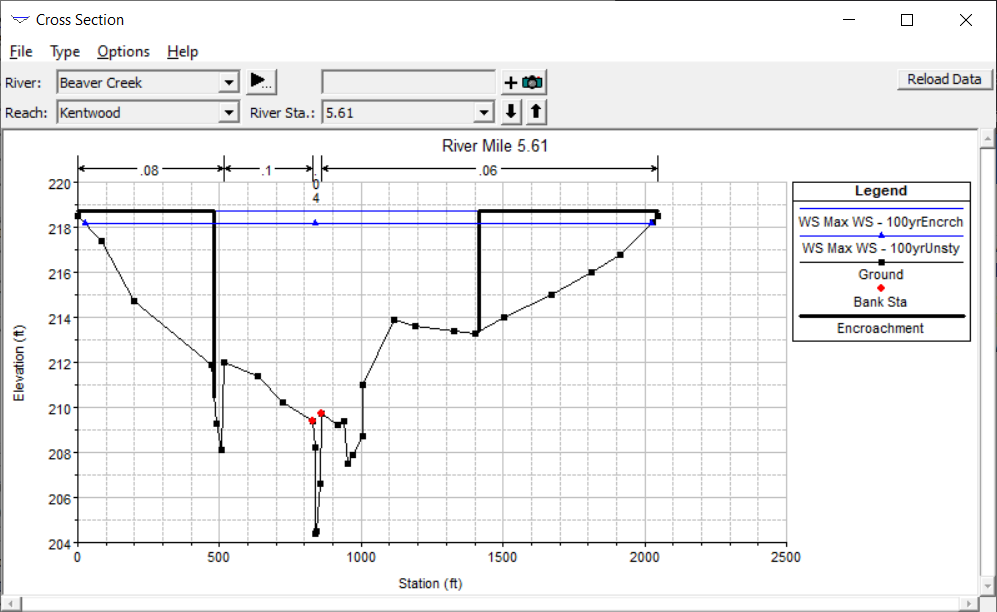
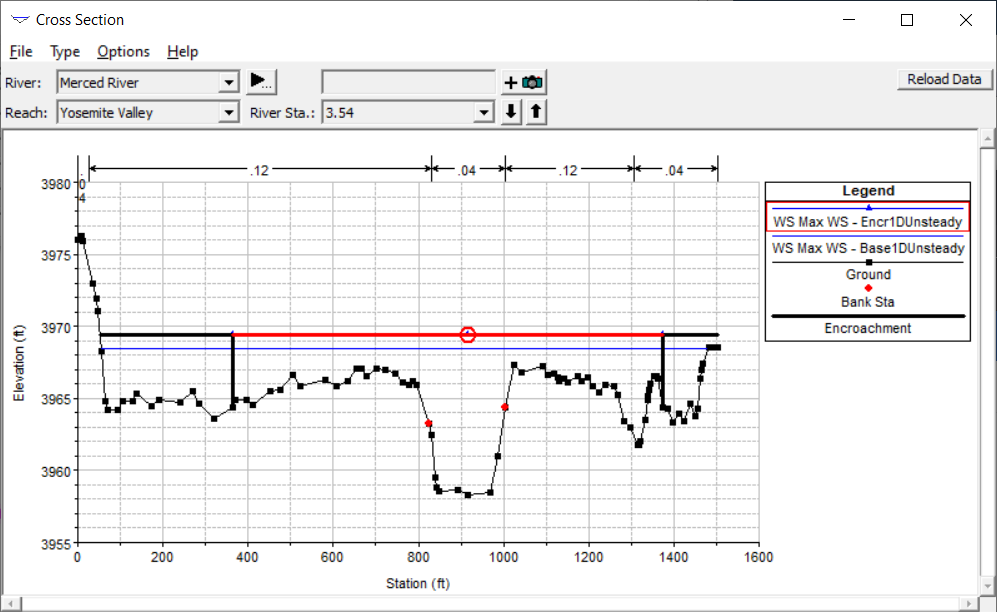
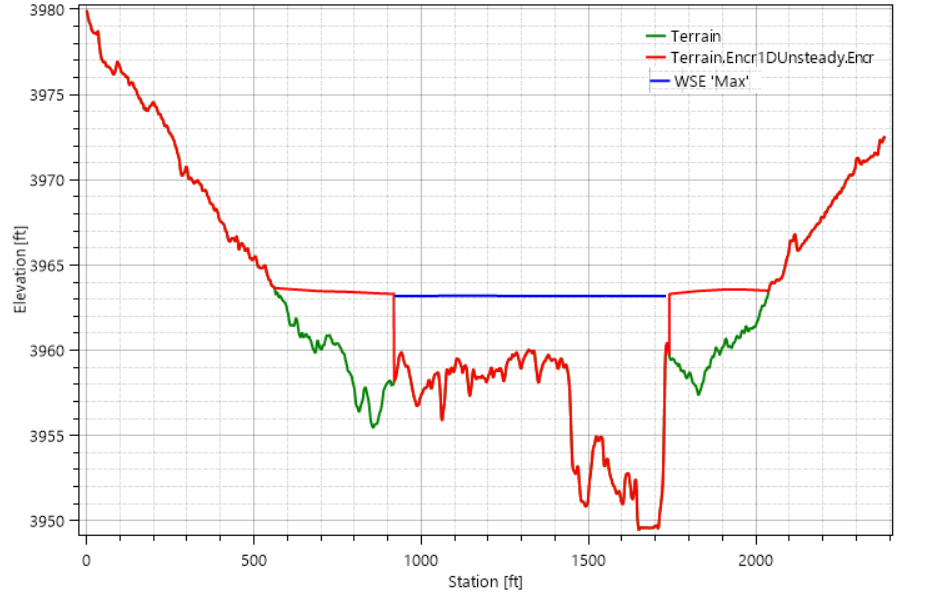
Floodplain encroachment results are available in both graphical and tabular results, both from using traditional methods and through RAS Mapper. The traditional XS Plot is shown in the figure below comparing the encroached plan to the base plan. Similarly, water surface Profile Plot is available.
HEC-RAS Mapper, however, provides much more visualization capability. Tables, plots, and maps are available to assist modelers with encroachment analysis. The Encroachment Results Table and the Encroachment Results Profile plot are available by right-clicking on the Plan Name or on Encroachment Regions layer in the Plan's Results group, while an Encroachment Surcharge and Velocity Difference maps are automatically generated.
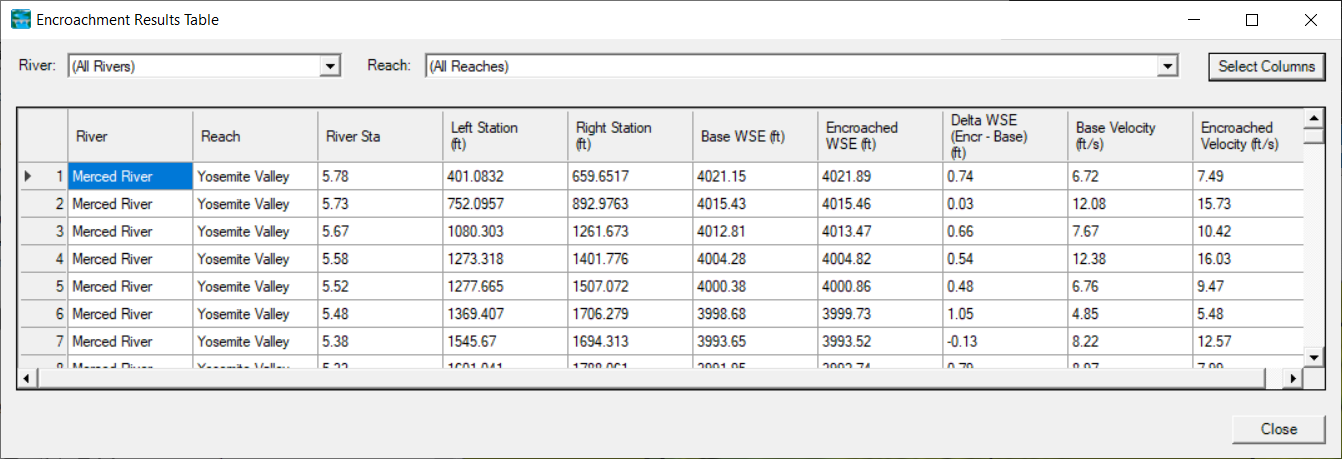
Show Encroachment Results Table
The Encroachment Results Table shows the encroachment stations for each cross section and allows the user to compare computed variables such as water surface elevations for the Base Plan and the Encroached Plan. The table allows the user to customize the table based on the output they wish to view. A full list and description of the variable is described below.
| Variable | Description |
|---|---|
| River, Reach, River Station | Identifies the cross section |
| Left Station / Right Station | Specifies the Encroachment location for the Left Station and Right Station |
| Base / Encroached WSE | Computed Water Surface Elevation for the specified plan |
| Delta WSE | Computed Surcharge between the Base and Encroached runs (Delta = Encroached - Base) |
| % K Reduced Left/Right | Percentage Conveyance reduced in the Left and Right overbanks |
| K Rise WS | Target WS surface used for Method 4 or final value for Method 5 |
| Base/Encroached Top Width | Wetted top width of cross section for the specified plan |
| Base/Encroached Area | Wetted area of the cross section for the specified plan |
| Base/Encroached Velocity | Velocity of the cross section for the specified plan |
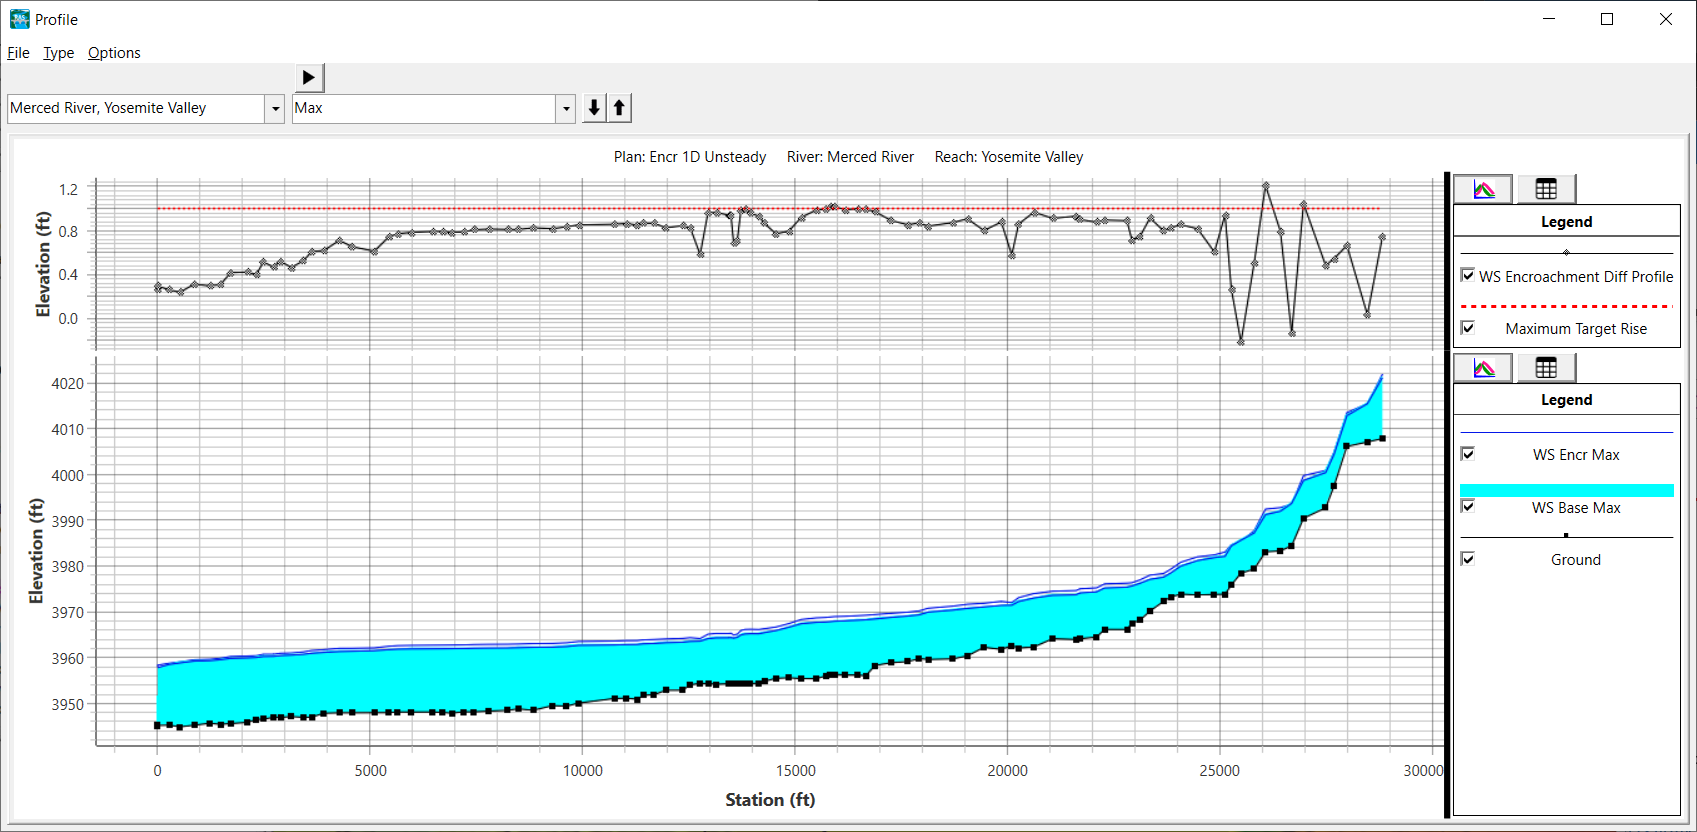
Plot Encroachment Results Profile
The Profile Plot allows the user to quickly identify differences between the Encroached plan and the Base plan. The top plot shows the allowable Target WS Rise with the computed difference between the Encroached WSE and the Base WSE. The change in Energy Grade between the two plans is also available. The bottom of the plot shows the computed water surface profile for both plans.
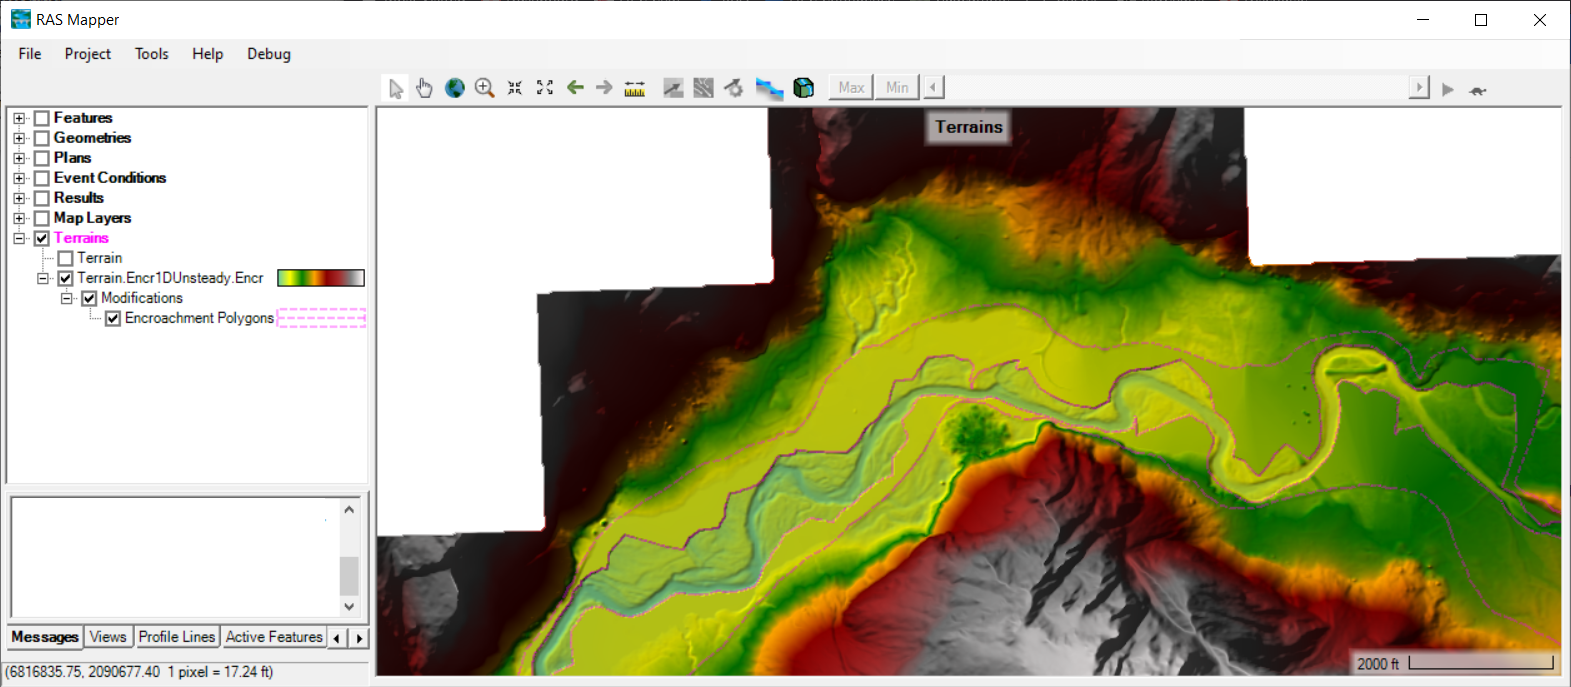
Encroached Terrain
When an encroachment run is performed, a new RAS Terrain is created using the computed (or set) encroachment stations to establish Terrain Modifications. The Terrain Modification will have the elevations within the modification increase to the specified Target WS Rise. This will assist the user to visualize the change to the floodplain and in computing the amount of fill that may be required, should development occur to the floodway fringe. The new RAS Terrain will be a Clone of the Terrain used for the base plan and will have the base Terrain name suffixed with the encroached plan and "Encr" (e.g. Terrain.1DEncroached.Encr").
The addition of the Terrain Modification identifies the direct impact of filling in the floodway fringe. To investigate the impacts of encroachment to the hydraulic results, tables and plots are available via layers in the Results group. Right-clicking on the Encroachment Regions will provide access to a customizable table and plot.
A comparison of the Terrain models with the Encroached water surface is shown in the figure below.
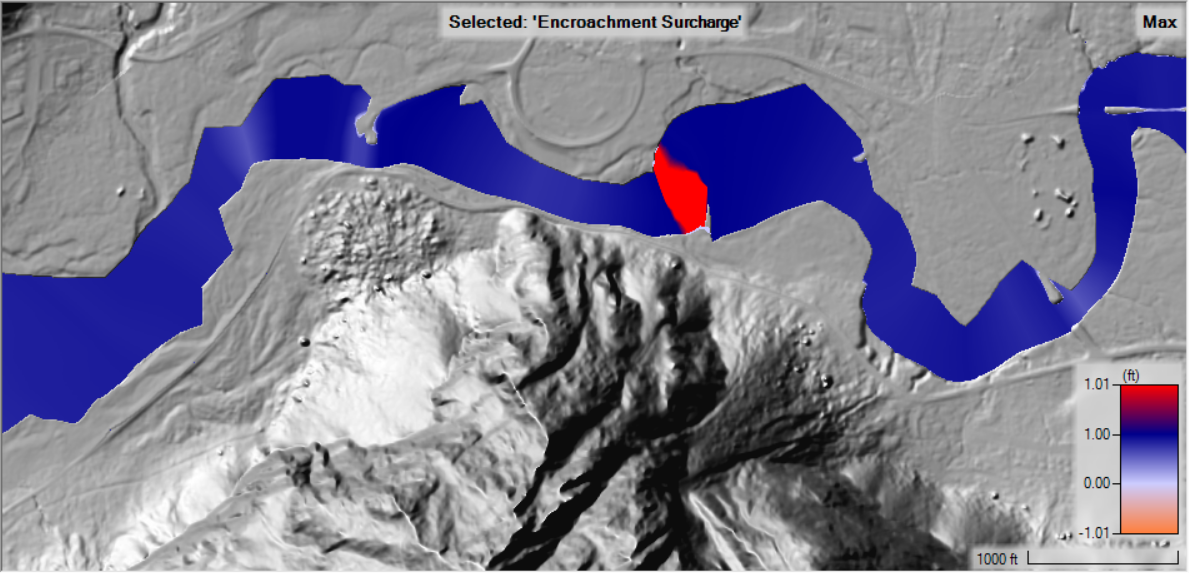
Encroachment Surcharge
An Encroachment Surcharge map is also automatically created. This map is the water surface elevation difference between the Encroached and Base plans. The Surcharge map can be used to quickly identify locations that do not meet expectations and assist in refining the floodway encroachment. An example Encroachment Surcharge map is shown below.
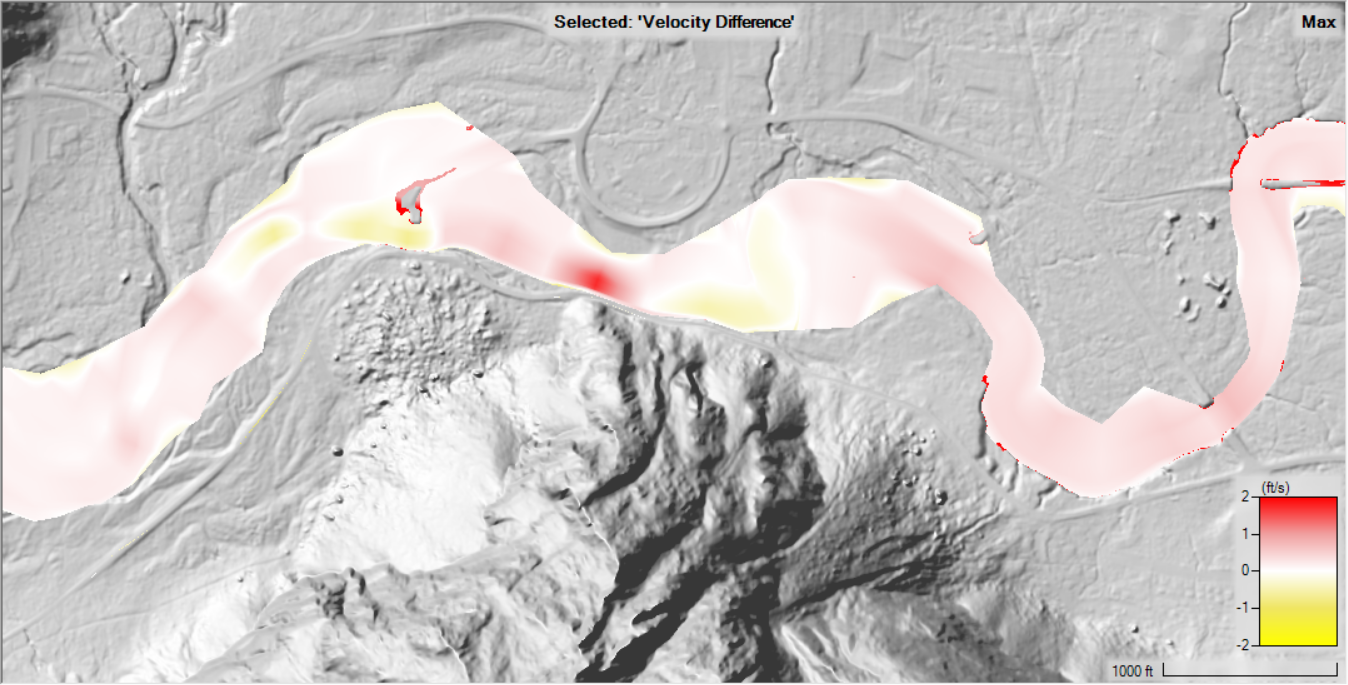
Velocity Difference
A Velocity Difference map is also automatically created. This map is the difference in velocities between the Encroached and Base plans. The Velocity map should be used to quickly identify locations that may adversely affect the stability of the river floodplain. An example Velocity Difference map is shown below.