Download PDF
Download page Troubleshooting With HEC-RAS.
Troubleshooting With HEC-RAS
For a steady flow analysis, the HEC-RAS software is designed to continue its computations all the way through completion, even when the user has entered poor data. Because of this, the fact that the program executes a complete run does not necessarily mean that the results are good. The user must carefully review the results to ensure that they adequately represent the study reach and that they are reasonable and consistent. The HEC-RAS software is an engineering tool, it is by no means a replacement for sound engineering.
The HEC-RAS software contains several features to assist the user in the development of a model; debugging problems; and the review of results. These features include: built in data checking; an Errors, Warnings, and Notes system; and a computational Log Output file. In addition to these features, the user can use the graphical and tabular output to review the results and check the data for reasonableness and consistency.
Most of the information contained within this chapter is based on performing a steady flow analysis. Much of the information is also useful when performing an unsteady flow analysis. More assistance for solving unsteady flow stability problems can be found in Chapter 7 of this manual (Performing a 1D Unsteady Flow Analysis).
Built in Data Checking
The HEC-RAS user interface has two types of built in data checking. The first type of data checking is performed as the user enters the data. Each data field of the data entry editors has some form of data checking. The second type of data checking occurs when the user starts the steady flow or unsteady flow computations. When the user presses the compute button, on the steady flow or unsteady flow analysis window, the entire data set is processed through several data checks before the computations begin. A detailed discussion of each of these two data checking features is described below.
Checking the Data as it is Entered
This type of data checking occurs whenever the user enters data into a single data field or table. Once the user leaves a particular data entry field or table, the program will automatically check that data for reasonableness. The following is a list of some of the types of data checks that are performed:
- Minimum and maximum range checking for variables.
- Alpha and numeric data checks. This is done to ensure that the right type of data is entered in each field.
- Increasing order of station for cross sections, bridge deck/roadway, and abutments.
- Data consistency checks (i.e., when the main channel bank stations are entered, the program checks to see if they exist in the cross section station and elevation data).
- Data deletion warnings. When you delete data the software will give you a warning before it is deleted.
- File management warnings (i.e., program will give you a chance to save the data to the hard disk before the program is closed, or a different data set is opened).
- Data geometry checks (i.e., when a bridge deck/roadway is entered, the program checks to ensure that the deck/roadway intersects with the ground data).
Data Checking before Computations are Performed
The second type of data checking is performed to evaluate the completeness and consistency of the data. This type of data checking occurs before the computations take place. When the user presses the Compute button on the Steady Flow or Unsteady Flow Analysis window, the program will perform a series of data checks before the computations are allowed to proceed. If any data errors are found, the program will not perform the computations. The following is a list of some of the types of checks that are made during this time:
- Data completeness. These data checks insure that all of the required data exists for the entire data set. If any missing data are found, a complete list of all the missing data and their specific locations is displayed on the screen. An example of this is shown in the figure below.
- Data consistency. This type of data checking is performed to ensure that the data is consistent with the computations that are being requested. For example, if the user asks to perform a mixed flow regime computation, the program checks to ensure that upstream as well as downstream boundary conditions have been specified. Likewise, if an encroachment analysis is requested, the program checks to ensure that the number of profiles lines up with the number specified in the encroachment data. There are several other checks of this type.
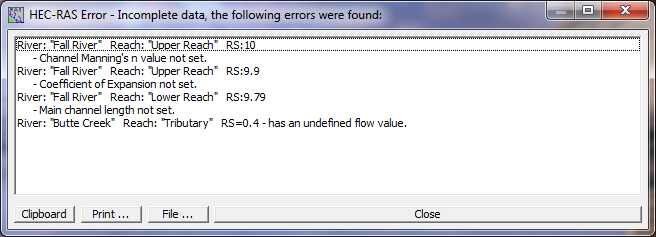
Data Completeness Checking Window
Errors, Warnings, and Notes
The HEC-RAS software has a system of Errors, Warnings, and Notes that are passed from the computation programs to the user interface. During the computations, the computation programs will set flags at particular nodes (nodes are cross sections, bridges, culverts, or multiple openings) whenever it is necessary. These message flags are written to the standard output file, along with the computed results for that node. When the user interface reads the computed results from the output file, if any errors, warnings, or notes exist, they are interpreted and displayed in various locations from the interface.
The user can request a summary of all the errors, warnings, and notes that occurred during the computations. This is accomplished by selecting Summary Errors, Warnings, and Notes from the View menu on the main HEC-RAS window. Once this is selected, a window will pop up displaying all of the messages. The user can select a specific River and Reach, as well as which Profile and Plan to view. The user has the options of expanding the window; printing the messages; or sending them to the windows clipboard. An example of the Errors, Warnings, and Notes window is shown in the figure below.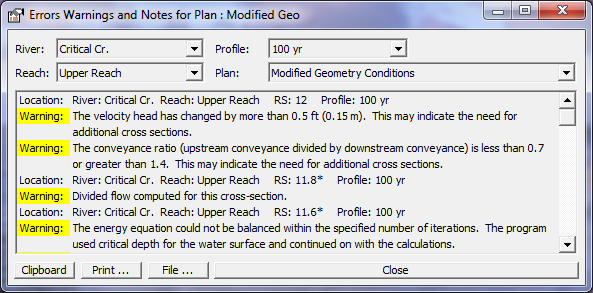
Summary of Errors, Warnings, and Notes Window
Besides the summary window, messages will automatically appear on the cross section specific tables. When a cross section or hydraulic structure is being displayed, any errors, warnings, or notes for that location and profile will show up in the Errors, Warnings, and Notes message box at the bottom of the table. An example of this table is shown in the figure below.
In general, the errors, warnings, and notes messages should be self explanatory. The three categories of messages are the following:
- Errors: Error messages are only sent when there are problems that prevent the program from being able to complete the run.
- Warnings: Warning messages provide information to the user that may or may not require action on the user's part. In general, whenever a warning is set at a location, the user should review the hydraulic results at that location to ensure that the results are reasonable. If the hydraulic results are found to be reasonable, then the message can be ignored. However, in many instances, a warning level message may require the user to take some action that will cause the message to disappear on future runs. Many of the warning messages are caused by either inadequate or bad data. Some common problems that cause warning messages to occur are the following:
- Cross sections spaced to far apart. This can cause several warning messages to be set.
- Cross sections starting and ending stations not high enough. If a computed water surface is higher than either end point of the cross section, a warning message will appear.
- Bad Starting Water Surface Elevation. If the user specifies a boundary condition that is not possible for the specified flow regime, the program will take action an set an appropriate warning message.
- Bad Cross Section Data. This can cause several problems, but most often the program will not be able to balance the energy equation and will default to critical depth.
- Notes: Note level messages are set to provide information to the user about how the program is performing the computations.
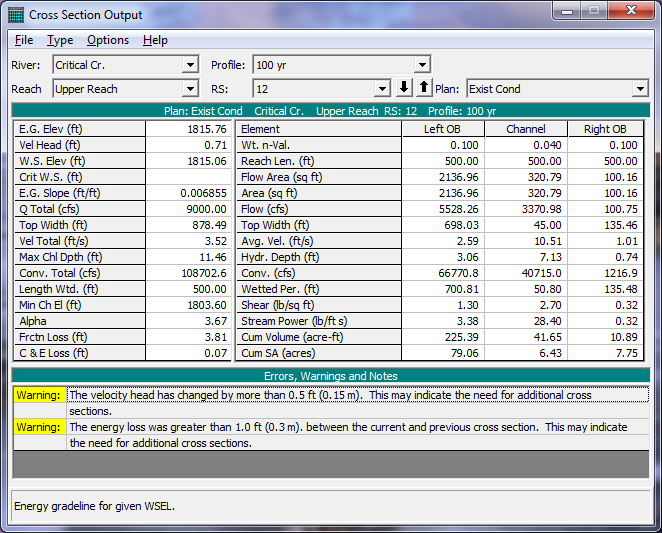
Cross Section Table with Errors, Warnings, and Notes
Steady Flow Log Output
This option allows the user to set the level of the Log file for a steady flow analysis. This file contains information tracing the program process. Log levels can range between 0 and 10, with 0 resulting in no Log output and 10 resulting in the maximum Log output. In general, the Log file output level should not be set unless the user gets an error during the computations. If an error occurs in the computations, set the log file level to an appropriate value. Re-run the computations and then review the log output, try to determine why the program got an error.
When the user selects Set Log File Output Level from the Options menu, a window will appear as shown in the figure below. The user can set a "Global Log Level," which will be used for all cross sections and every profile. The user can also set log levels at specific locations for specific profiles. In general, it is better to only set the log level at the locations where problems are occurring in the computations. To set the specific location log level, first select the desired reach and river station. Next select the log level and the profile number (the log level can be turned on for all profiles). Once you have everything set, press the Set button and the log level will show up in the window below. Log levels can be set at several locations individually. Once all of the Log Levels are set, press the OK button to close the window.
Warning
Setting the global log output level to 4 or 5 can result in very large log file output. Global log level values of 6 or larger can result in extremely large log files.
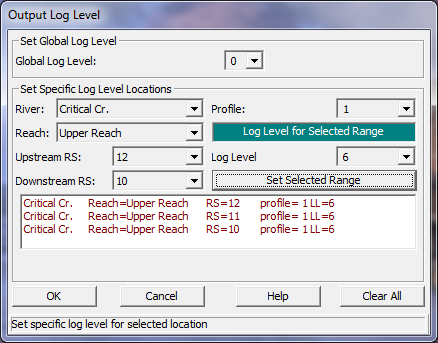
Log File Output Level Window
Unsteady Flow Log Output
The unsteady flow computation program can write out a detailed log file of its computations. This file is very different from the steady flow program, but serves the purpose of debugging computational problems. This option is turned on by selecting Output Options from the Options menu on the Unsteady Flow Analysis window. When this option is selected a window will appear as shown in Figure 10-5.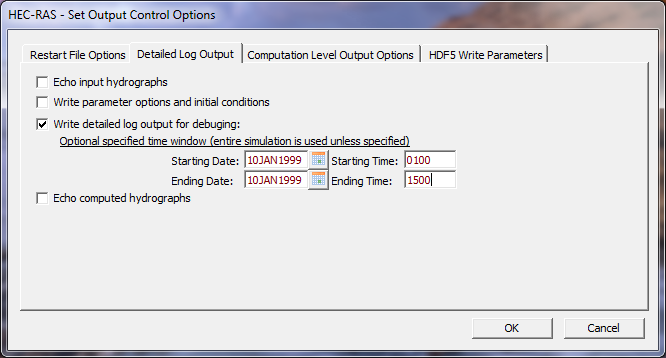
Unsteady Flow Output Control Window
As shown in the figure above, this option controls various types of output. To turn on the detailed log output, the user must check the box labeled Write Detailed Log Output for Debugging. The user has the option for setting a time window, which will limit the output to only within this time frame. After this option is selected, the computations must be rerun in order for the output to be produced.
Viewing the Log File
This option allows the user to view the contents of the log file. For steady flow analyses, the user brings up the log output by selecting View Log File from the Options menu of the Steady Flow Analysis window. For unsteady flow analyses, the user brings up the log output by selecting View Computation Log File from the Options menu of the Unsteady Flow Analysis window. The interface uses the Windows Write program to accomplish viewing the output (unless the user has set a different program to be used as the default file viewer). It is up to the user to set an appropriate font in the Write program. If the user sets a font that uses proportional spacing, the information in the log file will not line up correctly. Some fonts that work well are: Line Printer; Courier (8 pt.); and Helvetica (8 pt.). Consult your Windows user's manual for information on how to use the Write program.
Reviewing and Debugging the Normal Output
After the user has successfully completed a run, and reviewed all the errors, warnings, and notes, the normal output should be reviewed for consistency and reasonableness.
Viewing Graphics
In general, the graphical output should be used as much as possible to get a quick view of the results. The user should look at all of the cross sections with the cross section plotting capability. The cross section plots will assist the user in finding data mistakes, as well as possible modeling mistakes (mistakes in ineffective flow areas, levees, n values, etc.).
The profile plotting capability is a good way to get a quick overview of the entire study area. The user should look for sudden changes to the energy grade line and the water surface. In general, these two variables should transition smoothly along the channel. If the user finds rapid changes in the energy or the water surface, the results at those locations should be reviewed closely to ensure that they are correct.
The X-Y-Z Perspective Plot can also be used to get a quick view of an entire reach. This plot is very helpful for viewing the top width of the flow area. If the user finds dramatic changes in the top width from one cross section to the next, then the results at those locations should be reviewed closely. Dramatic changes in top width may indicate the need for additional cross sections.
Viewing Tabular Output
There are several types of tabular output. The user should try to make use of all of them when viewing tabular results. In general, the profile summary types of tables should be used to get an overview of some of the key variables at several locations. If any problems are found, or any results that seem suspect, the user should use the detailed output specific tables to get detailed results at a single location.
The Occurrence of Critical Depth
During the steady flow water surface profile calculations, the program may default to critical depth at a cross section in order to continue the calculations. Critical depth can occur for the following reasons:
- Bad cross section data: If the energy equation can not balance because of bad cross section data, the program defaults to critical depth.
- Program can not balance the energy equation above or below the top of a levee or ineffective flow area: On occasion, when the program is balancing a water surface that is very close to the top of a levee, or an ineffective flow area, the program may go back and forth (above and below the levee) without being able to balance the energy equation. When this occurs, the program will default to critical depth.
- Cross sections spaced too far apart: If the cross sections are spaced to far apart, the program may not be able to calculate enough energy losses to obtain a subcritical water surface at the upstream section.
- Wrong flow regime: When calculating a subcritical profile, and the program comes to a reach that is truly supercritical, the program will default to critical depth. Likewise, when calculating a supercritical profile, if the reach is truly subcritical, the program will default to critical depth.
Computations Do Not Run to Completion
While running the computational part of the software, when the steady flow program is finished you should get the message "Finished Steady Flow Simulation" or "Finished Post Processing," for an unsteady flow run. If the user has entered bad data, the computational program may not be able to run to completion. When this happens the program will stop and write an error message to the screen. This message may be a trapped error by the program, or it could be just a generic Fortran error message. Fortran error messages come from the Fortran compiler that was used to develop the computational program. The message basically says that a math error occurred and therefore the program could not continue. When this type of error occurs, it is most often a data input problem. There is a possibility that it could be a bug in the program, but the user should exhaust all the possible data input errors before assuming that the program has a "Bug."
The first step in finding the problem is to realize where the error is occurring. For a steady flow analysis, the program will display which cross section it is working on, and for which profile. This means that the error occurred at that cross section (or hydraulic structure, such as a bridge). Go to the Geometric Data editor and review the input data closely at the problem location.
During an unsteady flow analysis, the program displays the time step that it is working on and the number of iterations it took to solve the equations. As the program is running, if it consistently goes to the maximum number of iterations (20 is the default), the user should take not of the time step that this started to occur. The user must turn on the detailed log output, and then review that output in the vicinity of that particular time step, in order to figure out what is going wrong.
Computational errors often occur at bridges. Check your data closely for any inconsistencies in the bridge geometry. Many of the problems that occur at bridges are due to bad Deck/Roadway data. Go to the Bridge/Culvert Data editor and turn on the option Highlight Weir, Opening Lid and Ground from the View menu. This option will assist you in finding any geometric mistakes in the bridge data.