If the user is running HEC-RAS in unsteady flow mode (1D or 2D), and you have added breaching information for one or more of the structures that can be breached (Inline structures, Lateral structures, and SA/2D Area Connections), then the Breach Hydrograph plot can be used to display key information about the breach.
The Breach Hydrograph plot has three simultaneous plots and a table all on the same window. By default the plot will come up with a summary table at the top, then three plot windows: 1) Stage and flow hydrographs for the structure; 2) Breach bottom width vs time; and 3) Average velocity vs time through the breach. Additionally there is a Table Tab just left of the breach. If the Table tab is selected, the user will see a detailed table for the left half of the window, and the plot will be on the right half of the window (the user can adjust the size of both). This table contains all of the time series data being shown in the plots.
An example of the new Breach Hydrograph plot for an inline structure (Dam in this example) is shown in Figure 8-19 below.
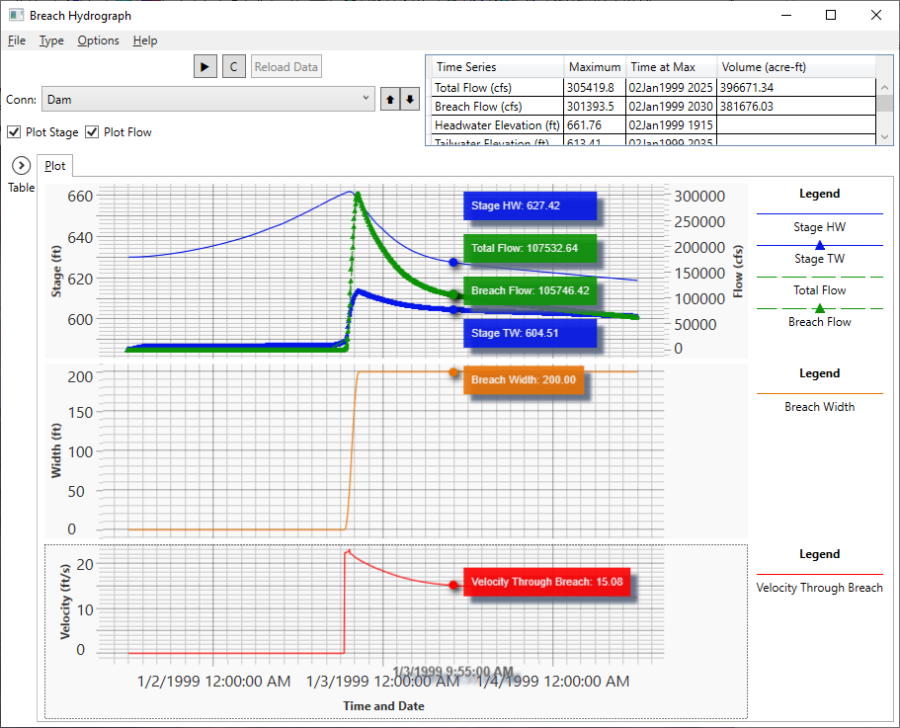
Figure 8 19. Breach Hydrograph Plot for Inline Structure with a Breach.
As shown in Figure 8-19, if the user left clicks on the plot window, a series of "Bobbers" will show up on top of each line, and the value of each line at that point is shown to the right of the Bobber Dot. This is a very handy feature for obtaining the magnitude of each piece of data at the same point in time.
From the Type menu at the top of the window, user's can select from the three types of structures that can contain breaching information: Inline Structures; Lateral Structures; and SA/2D Area Connections. Once a Breach Hydrograph Type is selected, the program will only load that type of structure, and only the ones that have breach information.
Under the Options menu, there are Options for selecting multiple Plans to plot, and there is an option for setting the number of decimal places of the numerical values shown on the plot and in the tables.
Additionally, if the user right click on the plot window, a Popup menu will appear with options to: Zoom In; Zoom Previous; Zoom Out; Full Plot; Pan; Select; Point Bobber; Copy to Clipboard; Tabulate; Lines and Symbols; Font sizes and Styles; grid; and Chart options.