If the user has performed an unsteady flow analysis, then stage and flow hydrographs will be available for viewing. To view a stage and/or flow hydrograph, the user selects Stage and Flow Hydrographs from the View menu of the main HEC-RAS window. When this option is selected a plot will appear as shown in Figure 8-20. The user has the option to plot just the stage hydrograph, just the flow hydrograph, or both as shown in the figure. Additionally, there are three tabs on the plot. The tabs are for plotting (Plot), viewing the data in tabular form (Table), and plotting a rating curve of the event (Rating Curve). By default, the window comes up in a plotting mode.
The stage and flow hydrograph plot also has a menu option to select the specific node types to be viewed. By default, the plot comes up with a node type of cross section selected. This allows the user to view hydrographs at cross sections only. Other available node types include: Bridges/Culverts; Inline Structures; Lateral Structures; Storage Areas; Storage Area Connections; and Pump Stations.
There are several options available for viewing this graphic. These options are the same as described previously for the cross section, profile, and rating curve plots. Additionally, this graphic can be sent to the windows clipboard, or the printer, as described under the previous plots.
Additional output for the hydrograph plot includes statistics about the hydrographs (peak stage and flow, time of peak, and volume). Also, the user can simultaneously plot observed hydrograph data at locations where they have gaged information stored in a DSS file. The user attaches gaged hydrograph information to cross section locations from the Unsteady Flow Data editor.
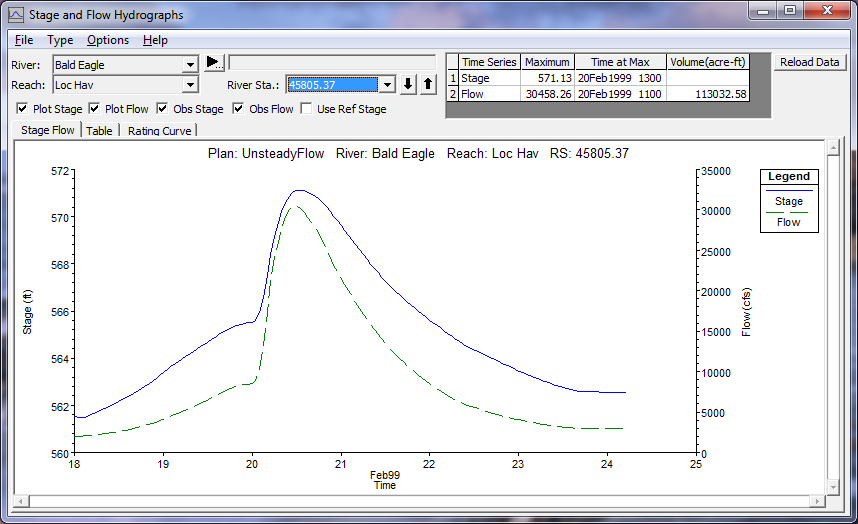
Figure 8 20 Stage and Flow Hydrograph Plot