The HEC-RAS software can write and read data to and from the HEC-DSS (Data Storage System) database. The steady flow portion of HEC-RAS can read flow data to be used as profile information, and can write water surface profiles, storage-outflow information, and rating curves. The unsteady flow portion of HEC-RAS can read complete hydrographs (stage and flow), profiles, rating curves, as well as gate settings to be used during a simulation. Observed data contained in a DSS file can be attached to specific cross sections for comparison with computed results at those locations, and computed profiles and hydrographs are written to the DSS file during an unsteady flow simulation.
Because a DSS file can be used to share information between different HEC programs (such as HEC-HMS and HEC-RAS), it is often necessary to be able to view data contained within a DSS file. A DSS viewer is available from within the HEC-RAS software. To bring up the DSS viewer select DSS Data from the View menu of the main HEC-RAS window (Or press the button labeled DSS on the main window). When this option is selected a window will appear as shown in Figure 8-33.
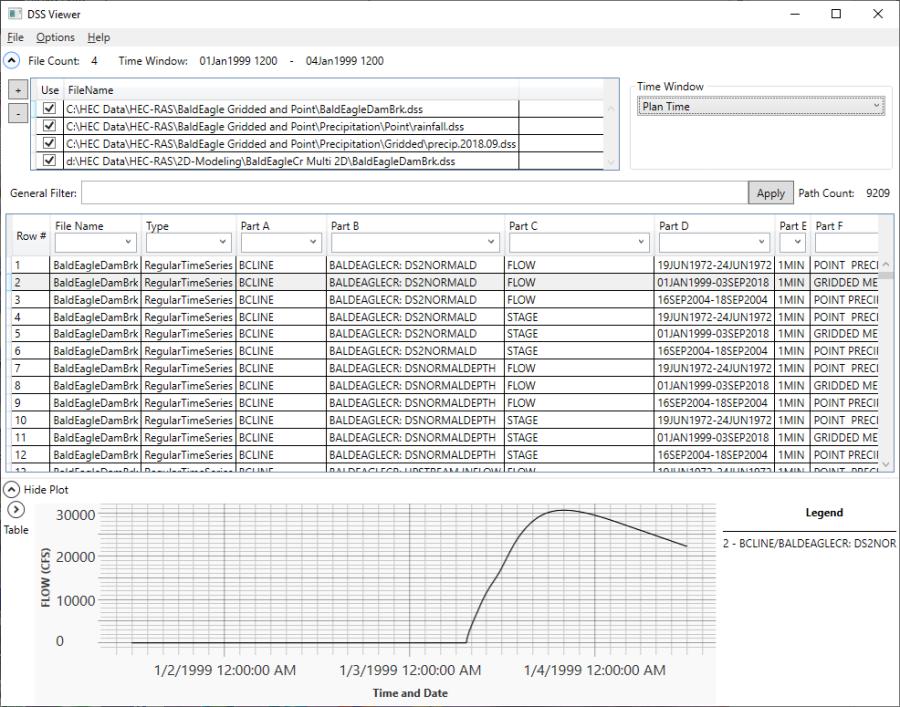
Figure 8 33 HEC-DSS Viewer Window
As shown in Figure 8-33, all of the DSS files associated with the current Plan will be loaded and are shown at the top of the window. Users can turn specific DSS files on and off. Additional DSS files not associated with the project can also be loaded by pressing the plus  button to the left of the table. When a DSS file(s) is selected, a list of the available pathnames within that file will show up in the table. Each DSS pathname represents a record of data stored within the DSS file(s). The user can select one or more DSS pathnames to be plotted and/or tabulated. A pathname is selected by using the left mouse button to select a row(s) in the table. Users can use the Control Key plus left mouse click to select additional pathnames. Additionally, the Shift key can also be used to select a range of pathnames. Once a Pathname or Pathnames are selected, the data will be plotted in the Plot window below the Pathname table as shown in Figure 8-33.
There is also an option to the left of the plot to bring up a table of the data shown within the plot. If the user hits the right arrow above the Table option, then a table will appear as shown in Figure 8-34.
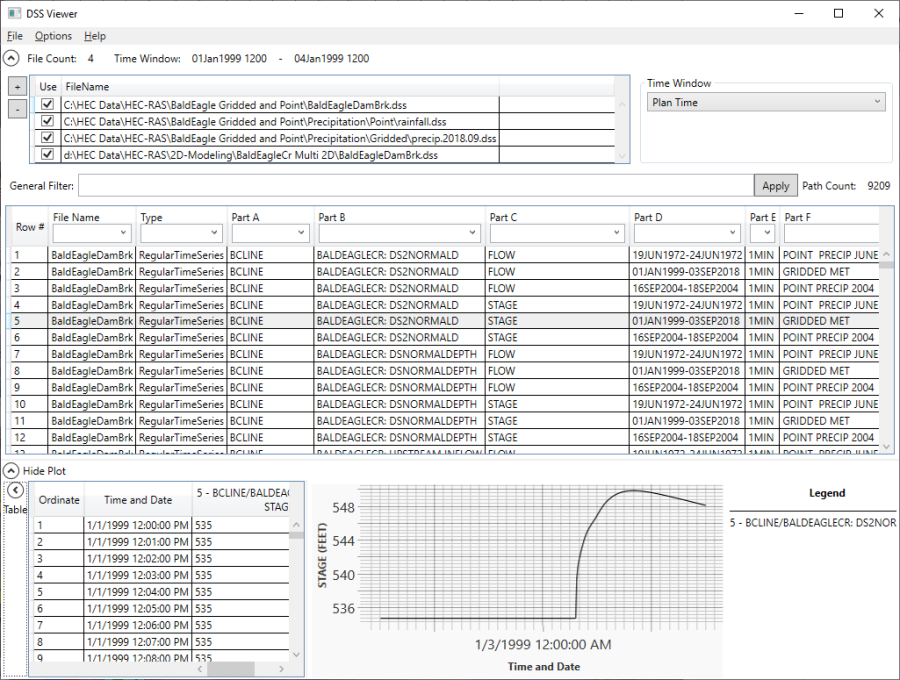
Figure 8 34 Example Plot from the HEC-RAS DSS Viewer
Data can be viewed from one or more DSS files simultaneously. The user simple selects the check box for the desired DSS files and picks the desired pathnames. The data will automatically be plotted and there is the option to tabulate the data.
The user has options available for setting the Time Window for plotting the data. By default, the time window will be set to the currently opened Plans time window. In the upper right corner of the plot is a Time Window drop down that allows the user to select from: Plan Time; All Available Data; and User Specified.
Users also have an option to control the number of decimal places displayed for the data in the tables. This can be selected from the Options menu at the top.