Download PDF
Download page Roughness Coefficients.
Roughness Coefficients
Roughness coefficients are one of the main variables used in calibrating a hydraulic model. Generally, for a free flowing river, roughness decreases with increased stage and flow (Figure 7-31). However, if the banks of a river are rougher than the channel bottom (due to trees and brush), then the composite n value will increase with increased stage. Sediment and debris can also play an important role in changing the roughness. More sediment and debris in a river will require the modeler to use higher n values in order to match observed water surfaces.

Figure 7 31. Roughness Versus Discharge for the Mississippi River at Arkansas City
Looped Rating Curves. Excluding cataclysmic events such as meander cutoffs or a new channel, the river will pass any given flow within a range of stages. The shift in stage is a result of the following: shifts in channel geometry or bed forms; the dynamics of the hydrograph (how fast the flood wave rises and falls); backwater (backwater can significantly change the stage at a given cross section for a given flow); and finally, the slope of the river (flatter streams tend to have greater loops in the rating curve). Figure 7-32 below shows a looped rating for a single event. Generally, the lower stages are associated with the rising side of a flood wave, and the higher stages are associated with the falling side of the flood wave.

Figure 7 32. Looped Rating Curve Example
Alluvial Rivers. In an alluvial stream the channel boundary, as well as the meandering pattern of the stream, are continuously being re-worked by the flow of water. Alluvium is unconsolidated granular material, which is deposited by flowing water. An alluvial river is incised into these alluvial deposits. The flow characteristics of the stream are defined by the geometry and roughness of the cross-section below the water surface. The reworking of the cross section geometry and meander pattern is greatest during high flow, when the velocity, depth of water, and sediment transport capacity are the greatest. For some streams, which approach an equilibrium condition, the change in morphology (landforms) is small. For other streams, the change in morphology is much larger. The change can be manifest as changes in roughness or a more dynamic change such as the cut-off of a meander loop, which shortens the stream and starts a process which completely redefines the bed.
A typical meandering river is shown in Figure 7-33 below. Pools are at the outside of bends, and a typical pool cross-section is very deep. On the inside of the bend is a point bar. Crossings are between the meander bends. A typical crossing cross-section is much shallower and more rectangular than a pool cross-section.

Figure 7 33. Morphology of a Meandering River
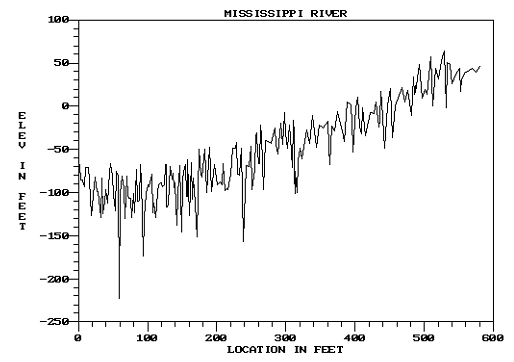
An invert profile for the Mississippi River is shown in the Figure 7-34. Note the pools and crossings. The water surface profile is controlled by the crossing cross-sections (high points in the invert), particularly at low flow. The conveyance properties of pool cross-sections are only remotely related to the water surface. This poses a significant problem when calibrating a large river.

Figure 7 34. Invert Profile for Lower Mississippi River
As stage and flow increase you have an increase in stream power (stream power is a function of hydraulic radius, slope, and velocity). The bed forms in an alluvial stream tend to go through the following transitions:
- Plane bed without sediment movement.
- Ripples.
- Dunes.
- Plane bed with sediment movement.
- Anti-dunes.
- Chutes and pools.
Generally, anti-dunes and chutes and pools are associated with high velocity streams approaching supercritical flow. The bed form process is shown graphically in Figure 7-35.

Figure 7 35. Transitions of Bed Forms in an Alluvial Stream
Typical Manning's roughness coefficients for the different bed forms presented above are shown in the following table:
Table 8-1 Roughness Variations for Alluvial Streams
Bed Forms |
Range of Manning's n |
Ripples |
0.018 – 0.030 |
Dunes |
0.020 – 0.035 |
Washed Out Dunes |
0.014 – 0.025 |
Plane Bed |
0.012 – 0.022 |
Standing Waves |
0.014 – 0.025 |
Antidunes |
0.015 – 0.031 |
Note: This table is from the book "Engineering Analysis of Fluvial Streams", by Simons, Li, and Associates.
Bed forms also change with water temperature. Because water is more viscous at lower temperatures, it becomes more erosive, reducing the height and the length of the dunes. At higher temperatures, when the water is less viscous, the dunes are higher and of greater length. Since the larger dunes are more resistant to flow, the same flow will pass at a higher stage in the summer than in the winter. Larger rivers such as the Mississippi River and the Missouri River show these trends. Figure 7-36 shows the seasonal shift for the Mississippi River at St. Louis.

Figure 7 36. Changes in Roughness due to Temperature in the Mississippi River