Download PDF
Download page Steady Flow Floodway Encroachment Analysis.
Steady Flow Floodway Encroachment Analysis
Within HEC-RAS, the data for performing a steady flow floodplain encroachment analysis are entered from the Steady Flow Analysis window. Encroachment information is not considered as permanent geometry or flow data, and is therefore not entered as such. The encroachment information is saved as part of the existing Plan data.
Steady Flow Encroachment Data Entry
To bring up the floodplain encroachment data window, select the Encroachments option from the Options menu of the Steady Flow Analysis window. When this option is selected an Encroachment window will appear as shown in the figure below (except yours will be blank when you first open it).
As shown in figure below, there are several pieces of data that the user must supply for an encroachment analysis. The encroachment analysis can only be performed for profiles 2 through 15 (or what ever number has been set by the user in the flow data editor). Encroachments are not performed on profile one because most of the encroachment methods rely on having a base profile for comparison.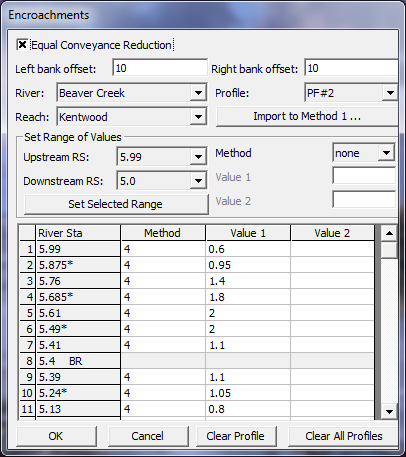
Floodplain Encroachment Data Editor
The data for an encroachment analysis should be entered in the following manner:
Global Information. Global information is data that will be applied at every cross section for every profile computed. The first piece of global information is the Equal Conveyance Reduction selection box at the top of the Encroachment data editor window. Equal conveyance reduction applies to encroachment methods 3, 4, and 5. When this is turned on, the program will attempt to encroach, such that an equal loss of conveyance is provided on both sides of the stream. If this option is turned off, the program will encroach by trying to maintain a loss in conveyance in proportion to the distribution of natural overbank conveyance. The default is to have equal conveyance reduction on.
The second item under global information is the Left bank offset and the Right bank offset. The left and right offsets are used to establish a buffer zone around the main channel for further limiting the amount of the encroachments. For example, if a user established a right offset of 5 feet and a left offset of 10 feet, the model will limit all encroachments to 5 feet from the right bank station and 10 feet from the left bank station. The default is to have no right or left offset, this will allow the encroachments to go up to the main channel bank stations, if necessary. River, Reach and River Station Selection Boxes. The next piece of data for the user to select is the river and reach in which to enter encroachment data. The user is limited to seeing one reach at a time on the encroachment data editor. Once a reach is selected, the user can then enter a Starting and Ending River Station to work on. By default, the program selects all the sections in the reach. The user can change this to any range of cross sections within the reach.
Profile. Next, the user should select a profile number to work on. Profiles are limited to 2 through the maximum number set in the currently opened flow data (e.g., 2 through 4, if the user has set 4 profiles in the flow data editor). The user can not set encroachments for profile 1.
Method and Target Values. The next step is to enter the desired encroachment method to be used for the currently selected profile. Once a method is selected, the data entry boxes that corresponds to that method will show up below the method selection box. Some of the methods require only one piece of data, while others require two. The user should then enter the required information that corresponds to the method that they have selected. For example, if the user selects encroachment method 4, only one piece of information is required, the target change in water surface elevation. The available encroachment methods in HEC-RAS are:
- Method 1 -User enters right and left encroachment station
- Method 2 -User enters a fixed top width
- Method 3 -User specifies the percent reduction in conveyance
- Method 4 -User specifies a target water surface increase
- Method 5 -User specifies target water surface increase and maximum change in energy
Set Selected Range. Once the encroachment method is selected, and its corresponding data are entered, the user should press the Set Selected Range button. Pressing this button will fill in the table below with the selected range of river stations; the selected method; and the corresponding data for the method. Note that, if the selected method only has one data item, that method's data will go under the Value 1 column of the table. If the selected method has two data items, the first goes into the Value 1 column and the second goes into the Value 2 column. Once the data is put into the table, the user can change the method and corresponding data values directly from the table.
At this point the user should repeat these tasks until all of the encroachment data are entered (i.e., for all the reaches and locations in the model, as well as all of the profiles for which the user wants to perform the encroachment analysis). Once all of the encroachment data are entered, the user presses the OK button and the data will be applied and the window will close. The user can return to the encroachment window and edit the data at any time. The encroachment data are not saved to the hard disk at this time, they are only saved in memory. To save the data to the hard disk, the user should either select Save Project from the File menu of the main HEC-RAS window, or select Save Plan from the File menu of the Steady Flow Analysis window.
The Import Method 1 option, allows the user to transfer the computed encroachment stations from a previous run (output file) to the input data for a future run. For example, if the user performs a preliminary encroachment analysis using any of the methods 2 through 5, they may want to convert the results from one of the runs to a method 1 encroachment method. This will allow the user to further define the floodway, using method 1, without having to enter all of the encroachment stations. The import of encroachment stations, in this manner, is limited to the results of a single encroachment profile for each reach.
Performing Steady Flow Encroachment Analysis
The HEC-RAS floodway procedure is based on calculating a natural profile (no encroachments) as the first profile of a multiple profile run. Subsequent profiles are calculated with the various encroachment options available in the program.
In general, when performing a floodway analysis, encroachment methods 4 and 5 are normally used to get a first cut at the encroachment stations. Recognizing that the initial floodway computations may provide changes in water surface elevations greater, or less, than the "target" increase, initial computer runs are usually made with several "target" values. The initial computer results should then be analyzed for increases in water surface elevations, changes in velocities, changes in top width, and other parameters. Also, plotting the results with the X-Y-Z perspective plot, or onto a topo map, is recommended. From these initial results, new estimates can be made and tested.
After a few initial runs, the encroachment stations should become more defined. Because portions of several computed profiles may be used, the final computer runs are usually made with encroachment Method 1 defining the specific encroachment stations at each cross section. Additional runs are often made with Method 1, allowing the user to adjust encroachment stations at specific cross sections to further define the floodway.
While the floodway analysis generally focuses on the change in water surface elevation, it is important to remember that the floodway must be consistent with local development plans and provide reasonable hydraulic transitions through the study reach. Sometimes the computed floodway solution, that provides computed water surfaces at or near the target maximum, may be unreasonable when transferred to the map of the actual study reach. If this occurs, the user may need to change some of the encroachment stations, based on the visual inspection of the topo map. The floodway computations should be re-run with the new encroachment stations to ensure that the target maximum is not exceeded.
Viewing Floodplain Encroachment Results
Floodplain encroachment results can be viewed in both graphical and tabular modes. Graphically, the encroachment results show up on the cross section plots as well as the X-Y-Z Perspective plot. An example cross-section plot is shown in the figure below.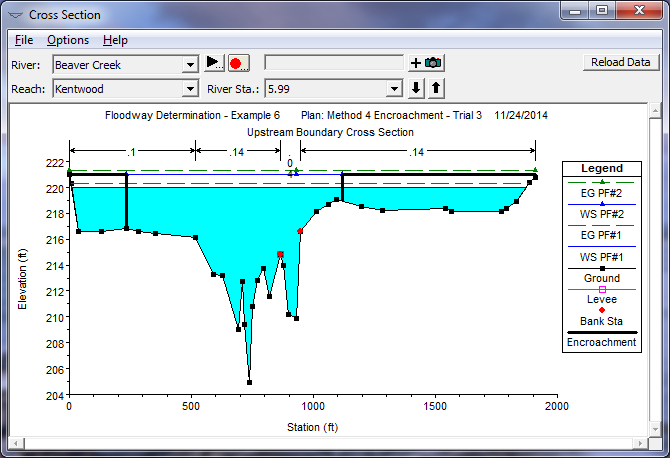
Example Cross Section Plot with Encroachments
As shown in the figure above, the encroachments are plotted as outlined blocks. In this example, the water surface profile for the base run (first profile) is plotted along with one of the encroached profiles. The user can plot as many profiles as they wish, but it may become a little confusing with several sets of encroachments plotted at they same time.
Another type of graphic that can be used to view the encroachments is the X-Y-Z perspective plot, an example is shown in the figure below. In this example, the base profile (Profile 1) as well as one of the encroached profiles is plotted at the same time over a range of cross sections. This type of plot allows the user to get a reach view of the floodplain encroachment. The user can quickly see if the encroachments transition smoothly or if they are erratic. In general, the final encroachments should have a consistent and smooth transition from one cross section to the next. With the assistance of this type of plot, the user may want to further refine the final encroachment stations and re-run the model.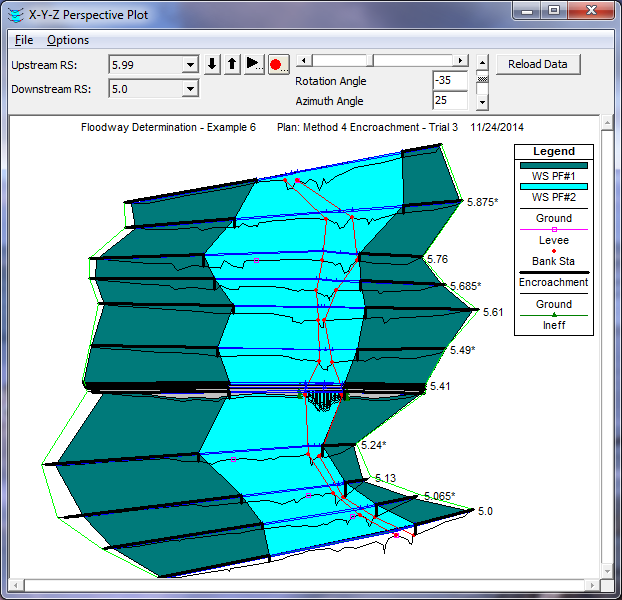
Example X-Y-Z Perspective Plot with Base and Encroached Profiles
Encroachment results can also be viewed in a tabular mode from the Profile Output Tables. Select Profile Table from the View menu of the main HEC-RAS window. When the table comes up, the user can select from three different pre-defined encroachment tables. To bring up one of the encroachment tables, select Encroachment 1 from the Std. Tables menu on the Profile table window. An example of Encroachment 1 table is shown in the figure below. The table shows the basic encroachment results of: computed water surface elevation; change in water surface from the base profile; the computed energy; top width of the active flow area; the flow in the left overbank, main channel, and right overbank; the left encroachment station; the station of the left bank of the main channel; the station of the right bank of the main channel; and the right encroachment station.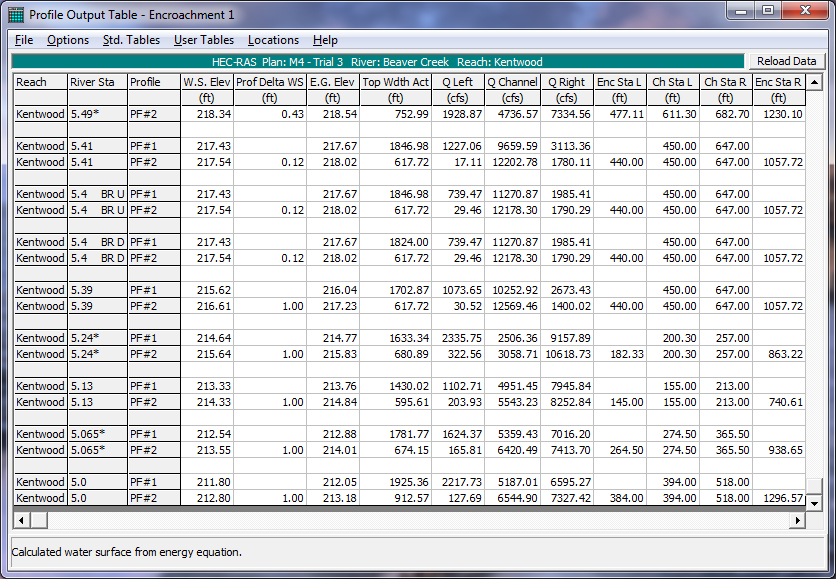
Example of the Encroachment 1 Standard Table
Encroachment 2 table provides some additional information that is often used when plotting the encroachments onto a map. This table includes: the change in water surface elevations from the first profile; the top width of the active flow area; the percentage of conveyance reduction in the left overbank; the left encroachment station; the distance from the center of the main channel to the left encroachment station; the station of the center of the main channel; the distance from the center of the main channel to the right encroachment station; the right encroachment station; and the percentage of conveyance reduction in the right overbank. An example of the Encroachment 2 standard table is shown below.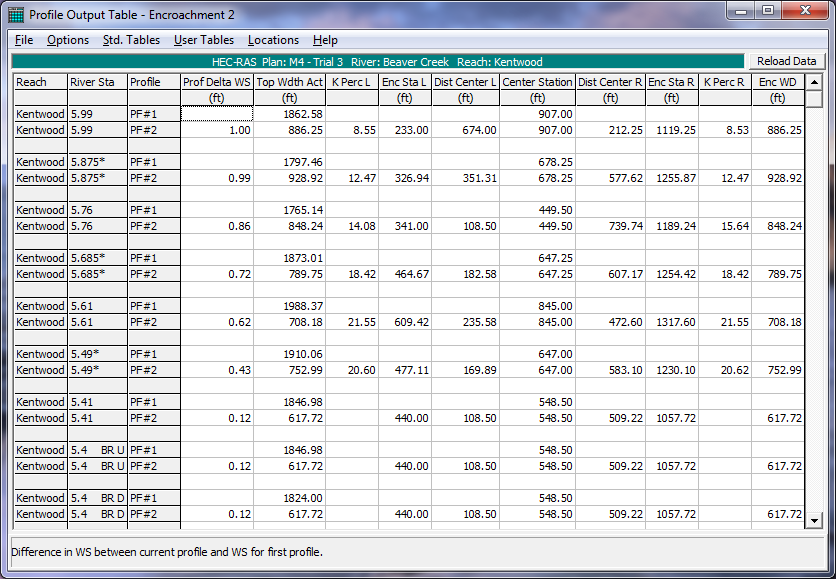
Example of the Encroachment 2 Standard Table
The last encroachment table, Encroachment 3, provides the minimum floodway data for reporting. This table includes: the active flow top width; the flow area (including any ineffective flow area); the average velocity of the entire cross section; the computed water surface elevation; the base water surface elevation (profile 1); and the change in water surface from the first profile. An example of this table is shown below.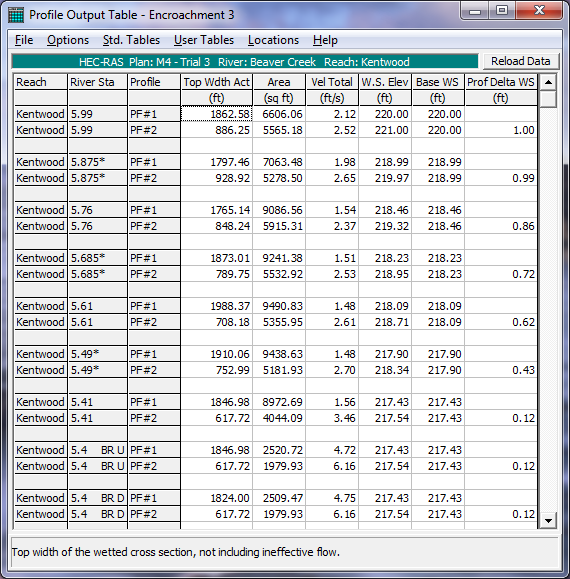
Example of the Encroachment 3 Standard Table