Download PDF
Download page Working With HEC-RAS.
Working With HEC-RAS
HEC-RAS is an integrated package of hydraulic analysis programs, in which the user interacts with the system using a Graphical User Interface (GUI). The system can perform Steady Flow water surface profile calculations, One and Two-dimensional unsteady flow computations, Sediment Transport/movable boundary computations, water quality analysis and several hydraulic design computations.
In HEC-RAS terminology, a Project is a set of data files associated with a particular river system. The modeler can perform any or all of the various types of analyses, included in the HEC-RAS package, as part of the project. The data files for a project are categorized as follows: plan data, geometric data, steady flow data, unsteady flow data, quasi-steady flow data, sediment data, water quality data, and hydraulic design data.
During the course of a study the modeler may want to formulate several different Plans. Each plan represents a specific set of geometric data and flow data (and possibly sediment data, water quality data, and hydraulic design information). Once the basic data are entered into the HEC-RAS, the modeler can easily formulate new plans. After simulations are made for the various plans, the results can be compared simultaneously in both tabular and graphical form.
HEC-RAS has the ability to lay out a model based on a geospatial coordinate system, or it can be developed without one. The very first versions of HEC-RAS did not utilize geospatial data, and all geometric data was developed from the HEC-RAS Geometry editor. However, if you want to bring in terrain data, extract model elevation information from that terrain, and perform inundation mapping of the model results, you must establish a geospatial coordinate system and develop a terrain model using HEC-RAS Mapper. HEC-RAS Mapper is a geospatial data development system in results mapping module contained directly from within HEC-RAS. HEC-RAS Mapper has an entirely separate user's manual that describes the following: how to establish a geospatial coordinate system for the project; developing a terrain model for use within HEC-RAS; laying out the HEC-RAS model geometry and extracting the terrain elevation data for model components; and visualizing results through maps, graphics, and tables.
In the current version of HEC-RAS, there are some duplication of tools for laying out the hydraulic model geometry between the Geometric data editor and HEC-RAS Mapper. If the user wants to work directly with a terrain model in a horizontal coordinate system, it is suggested to do most of that work in HEC-RAS Mapper. Once the model is laid out and terrain information is extracted, the user will still need to use the model component data editors (i.e. cross section editor, bridge/culvert editor, etc…) to parameterize the model fully.
This section provides an overview of how a hydraulic analysis study is performed with the HEC-RAS software.
Starting HEC-RAS
When you run the HEC-RAS Setup program, you automatically get a new program group called HEC and program icon called HEC-RAS. They should appear in the start menu under the section called Programs. The user also has the option of creating a shortcut on the desktop. The HEC-RAS icon looks like the following: ![]()
To start HEC-RAS from windows, double-click on the HEC-RAS icon. If you do not have an HEC-RAS shortcut, select Start | HEC | HEC-RAS.
When you first start HEC-RAS, you will see the main window as shown below (except you will not have any project files listed on your main window).
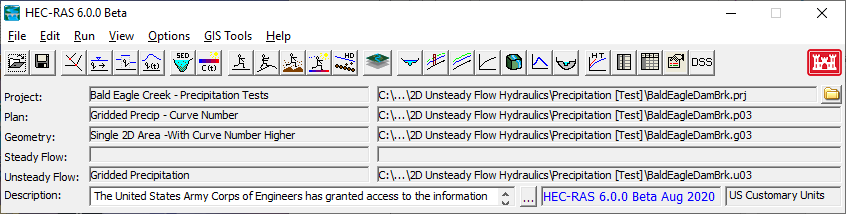
At the top of the HEC-RAS main window is a Menu bar with the options listed below.
- File: This option is used for file management. Options available under the File menu include: New Project; Open Project; Save Project; Save Project As; Rename Project: Delete Project; Project Summary; Import HEC-2 Data; Import HEC-RAS data; Generate Report; Export GIS Data; Export to HEC-DSS; Restore Backup Data; Debug Report; and Exit. In addition, the most recently opened projects will be listed at the bottom of the File menu, which allows the user to quickly open a project that was recently worked on.
- Edit: This option is used for entering and editing data. Data are categorized into six types: Geometric Data; Steady Flow Data; Quasi-Unsteady Flow; Unsteady Flow Data; Sediment Data; and Water Quality Data.
- Run: This option is used to perform the hydraulic calculations. The options under this menu item include: Steady Flow Analysis; Unsteady Flow Analysis; Quasi-Unsteady Sediment Analysis; Water Quality Analysis; Hydraulic Design Functions; and Run Multiple Plans.
- View: This option contains a set of tools that provide for graphical and tabular displays of the model output. The View menu item currently includes: Cross Sections; Water Surface Profiles; General Profile Plot; Rating Curves; 3D Perspective Plots; Stage and Flow Hydrographs; Hydraulic Properties Plots; Detailed Output Tables; Profile Summary Tables; Summary Err, Warn, Notes; DSS Data; Unsteady Flow Spatial Plot; Unsteady Flow Time Series Plot; WQ Spatial Plot; WQ Time Series Plot; Sediment Spatial Plot; Sediment Time Series Plot, and Sediment XS Changes Plot.
- Options: This menu item allows the user to change Program Setup options; set Default Parameters; establish the Default Units System (U.S. Customary or Metric); Convert Project Units (U.S. Customary to Metric, or Metric to U.S. Customary); and Convert Horizontal Coordinate System (this option allows the user to convert the entire HEC-RAS project from one horizontal coordinate system to another).
- GIS Tools: This menu item allows the user to go to the HEC-RAS Mapper; which can be used to create terrain models for use with HEC-RAS; display inundation mapping; and perform dynamic animations of flooding; along with many other mapping layers.
- Help: This option allows the user to get on-line help for HEC-RAS; display the HEC-RAS manuals (User's manual, Hydraulic Reference Manual, Applications Guide, and Release Notes); install example projects; How to customize the Help menu; go to the HEC-RAS web page; go to an online guide for selecting Manning's n values; view the terms and conditions of use statement; and display the current version information about HEC-RAS.
Also on the HEC-RAS main window is a Button bar (above figure). The button bar provides quick access to the most frequently used options under the HEC-RAS menu bar. A description of each button is shown in the figure below.
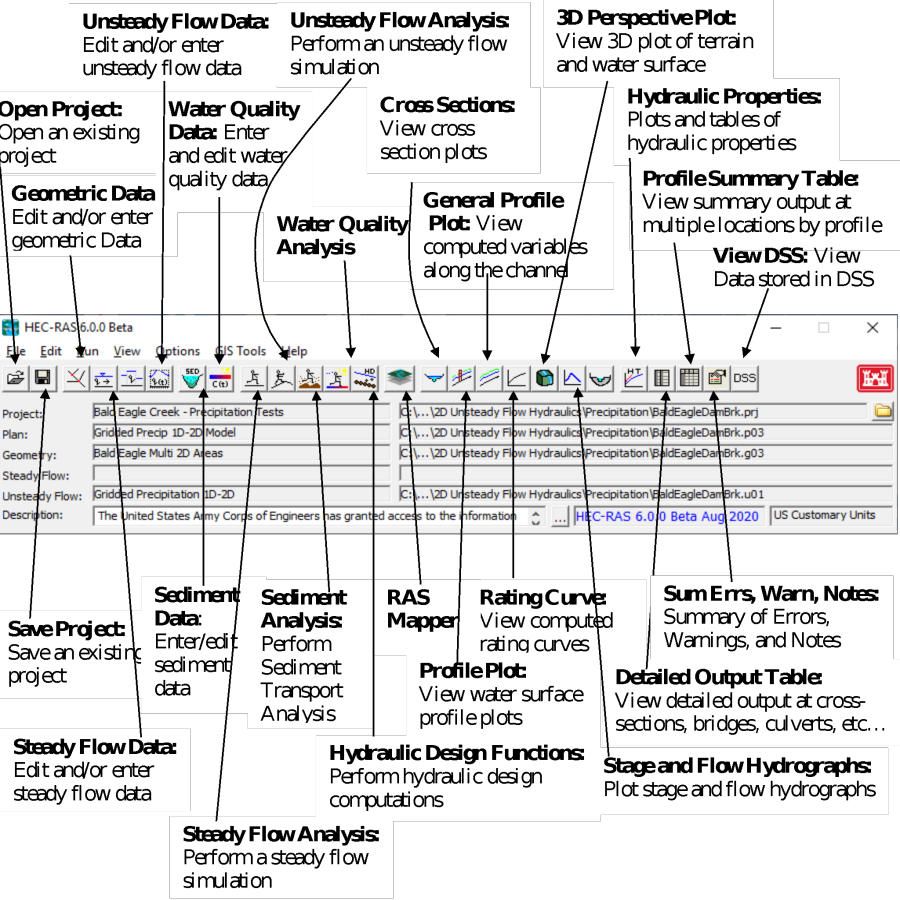
HEC-RAS Main Window Button Bar
Steps in Developing a Hydraulic Model with HEC-RAS
There are five main steps in creating a hydraulic model with HEC-RAS:
- Starting a new project
- Entering geometric data
- Entering flow data and boundary conditions
- Performing the hydraulic calculations
- Viewing and publishing results
Starting a New Project
The first step in developing a hydraulic model with HEC-RAS is to establish which directory you wish to work in and to enter a title for the new project. To start a new project, go to the File menu on the main HEC-RAS window and select New Project. This will bring up a New Project window as shown in the figure below.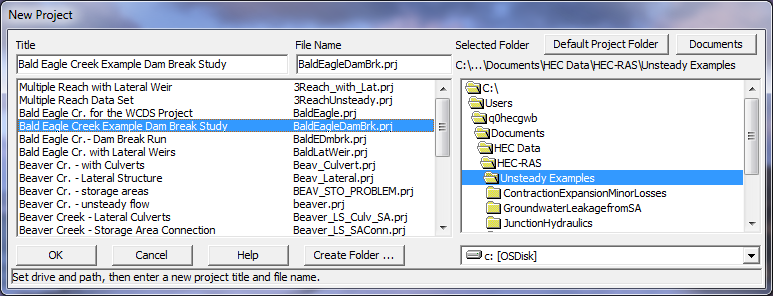
New Project Window
As shown in the figure above, you first select the drive and path that they want to work in (to actually select a path you must double click the directory you want in the directory box), next enter a project title and file name. The project filename must have the extension ".prj"; the user is not allowed to change this. Once you have entered all the information, press the "OK" button to have the information accepted. After the OK button is pressed, a message box will appear with the title of the project and the directory that the project is going to be placed in. If this information is correct, press the OK button. If the information is not correct, press the Cancel button and you will be placed back into the New Project window.
Setting the unit system for the project is accomplished by selecting Unit System from the Options menu of the main HEC-RAS window.
Entering Geometric Data
The next step is to enter the necessary geometric data, which consist of a background map layer (Optional), connectivity information for the stream system (River System Schematic), cross-section data, storage areas, two-dimensional (2D) flow areas, and hydraulic structure data (bridges, culverts, weirs, etc.).
This section describes how to use the HEC-RAS Geometric Data editor to lay out the Geometry, as well as how to put data into the data editors, and finish the parameterization of the model geometry.
To use the Geometric Data editor to enter geometry, select Geometric Data from the Edit menu on the main HEC-RAS window. Once this option is selected, the geometric data window will appear as show in the the figure below (except yours will be blank when you first bring this screen up for a new project). 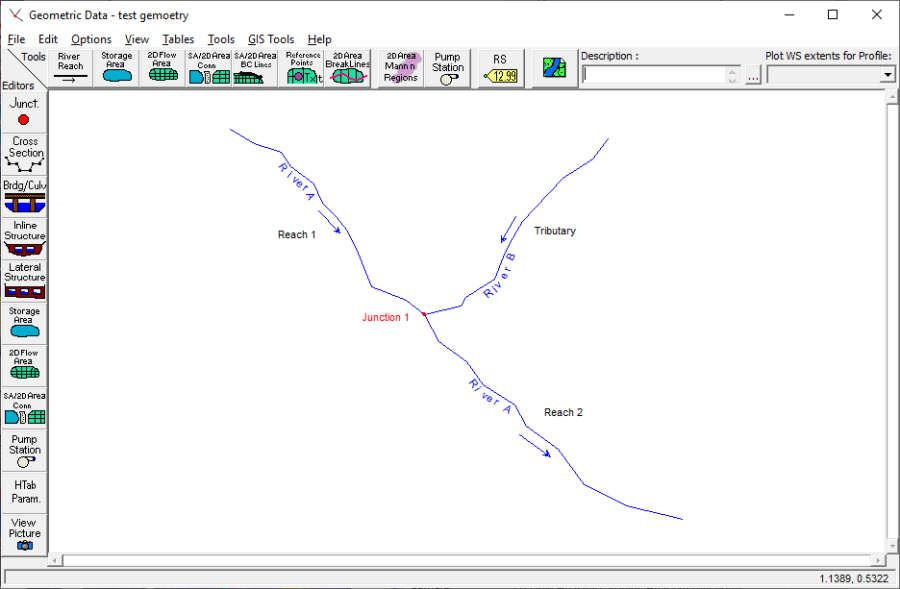
Geometric Data Window
When entering data directly into HEC-RAS from the geometric data editor, the data can still be entered in a georeferenced framework, or not. To establish a georeferenced framework, the use must first set a georeferenced projection in HEC-RAS Mapper. The various map and terrain layers can be brought into RAS Mapper. Any terrain or other background map layers that are brought into HEC-RAS Mapper can also be used as background maps in the HEC-RAS Geometry editor. Displaying background maps and terrain that have been setup in HEC-RAS Mapper is accomplished by selecting the background mapping button on the Geometry editor. ![]() To learn more about the background mapping capabilities, view the information on this option in Chapter 5 of this document.
To learn more about the background mapping capabilities, view the information on this option in Chapter 5 of this document.
The modeler can develop the geometric data in HEC-RAS by first drawing in the river system schematic. This is accomplished, on a reach-by-reach basis, by pressing the River Reach button and then drawing in a reach from upstream to downstream (in the positive flow direction). After the reach is drawn, the user is prompted to enter a "River" and a "Reach" identifier. The River and reach identifiers can be up to 16 characters in length. As reaches are connected together, junctions are automatically formed by the interface. The modeler is also prompted to enter a unique identifier for each junction. For more information on developing the river system schematic, see Chapter 6 "Entering and Editing Geometric Data."
After the river system schematic is drawn (See Figure 3-5), the modeler can start entering cross-section and hydraulic structure data. Pressing the Cross Section button causes the cross section editor to pop up. This editor is shown in the figure below. As shown, each cross section has a River name, Reach name, River Station, and a Description. The River, Reach and River Station identifiers are used to describe where the cross section is located in the river system. The "River Station" identifier does not have to be the actual river station (miles or kilometers) at which the cross section is located on the stream, but it does have to be a numeric value (e.g., 1.1, 2, 3.5, etc.). The numeric value is used to place cross sections in the appropriate order within a reach.
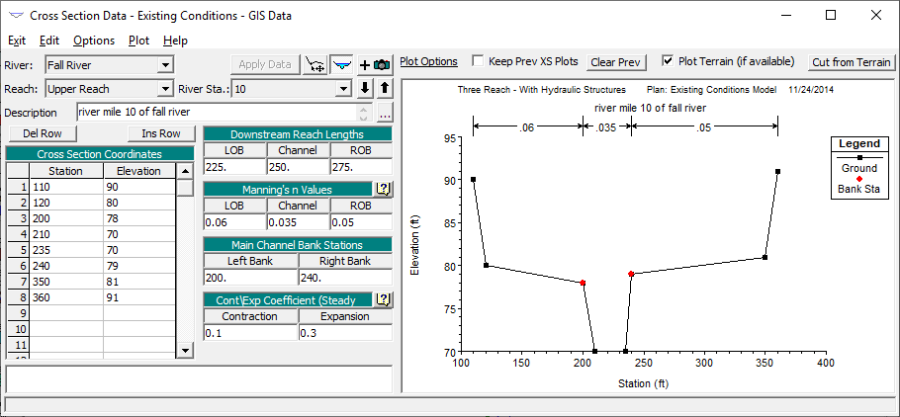
Cross Section Data Editor
The basic data required for each cross section are shown on the Cross Section Data editor above. The required data for any cross section consists of: station-Elevation data (Cross section point coordinates); downstream reach lengths (distances from the current cross section to the next cross section downstream); Manning's n values (at a minimum you must have a left overbank, main channel, and right overbank Manning's n value. There are several options for horizontal and vertical variations of Manning's n values); main channel bank stations (defines the left and right bank limits of the main channel); and contraction and expansion coefficients (defaults to 0.1 and 0.3 respectively). Additional cross section features are available under Options from the menu bar. These options include: adding, copying, renaming and deleting cross sections; adjusting cross section elevations, stations, and n or k-values; skew cross section; ineffective flow areas; levees; blocked obstructions; adding a lid to a cross section; add ice cover; add a rating curve; horizontal variation of n or k-values; and vertical variation of n values.
Also, available from the Cross Section Data editor is the ability to plot any cross section or reach profile. Edit features are available to cut, copy, paste, insert, and delete data from the Cross Section X-Y Coordinates grid.
Once the cross-section data are entered, the modeler can then add any hydraulic structures such as bridges, culverts, dams, weirs and spillways. Data editors, similar to the cross section data editor, are available for the various types of hydraulic structures. If there are any stream junctions in the river system, additional data are required for each junction. The Junction data editor is available from the Geometric Data window.
Once geometric data are entered, the data should be saved to a file on the hard disk. This is accomplished by selecting the Save Geometric Data As option from the File menu on the Geometric Data editor. This option allows the user to enter a title for the geometric data. A filename is automatically established for the geometric data, and then saved to the disk. Once a title is established, geometric data can be saved periodically by selecting Save Geometric Data from the File menu of the Geometric Data editor.
Entering Flow Data and Boundary Conditions
Once the geometric data are entered, the modeler can then enter either steady flow or unsteady flow data. The type of flow data entered depends upon the type of analyses to be performed. For the discussion in this chapter, it is assumed that a steady flow hydraulic analysis will be performed. The data entry form for steady flow data is available under the Edit menu bar option on the HEC-RAS main window.
An example of the steady flow data entry form is shown in the figure below, which is the Steady Flow Data Editor. As shown below, steady flow data consist of: the number of profiles to be computed; the flow data; and the river system boundary conditions. At least one flow must be entered for every reach within the system. Additionally, flow can be changed at any location within the river system. Flow values must be entered for all profiles.
Boundary conditions are required in order to perform the calculations. If a subcritical flow analysis is going to be performed, then only the downstream boundary conditions are required. If a supercritical flow analysis is going to be performed, then only the upstream boundary conditions are required. If the modeler is going to perform a mixed flow regime calculation, then both upstream and downstream boundary conditions are required. The Boundary Conditions data entry form can be brought up by pressing the Reach Boundary Conditions button from the Steady Flow Data entry form.
Once all of the steady flow data and boundary conditions are entered, the modeler should save the data to the hard disk. This can be accomplished by selecting Save Flow Data As from the File option on the Steady Flow Data menu bar. Flow data is saved in a separate file. The user is only required to enter a title for the flow data, the filename is automatically assigned.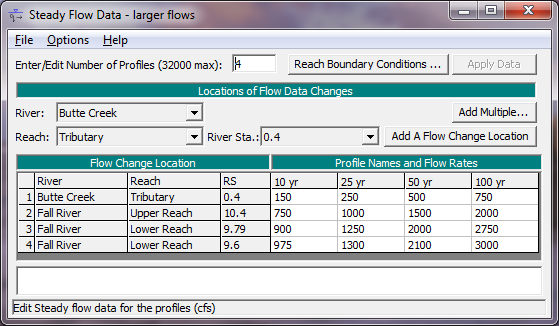
Steady Flow Data window
Performing Hydraulic Computations
Once all of the geometric data and flow data are entered, the modeler can begin to perform the hydraulic calculations. As stated previously, there are five types of calculations that can be performed in the current version of HEC-RAS: Steady Flow Analysis, Unsteady Flow Analysis, Sediment Transport/Mobile Boundary Modeling, Water Quality Analyses, and Hydraulic Design Functions. The modeler can select any of the available hydraulic analyses from the Run menu bar option on the HEC-RAS main window. An example of the Simulation Manager window is shown in the figure below, which is the Steady Flow Analysis window.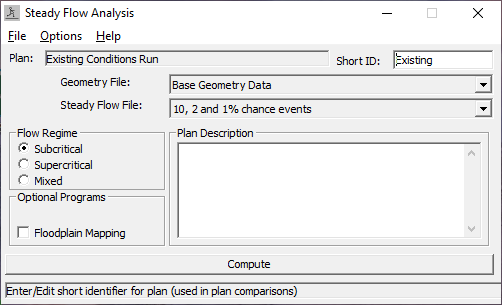
Steady Flow Analysis window
As shown in above, the modeler puts together a Plan by selecting a specific set of geometric data and flow data. A Plan can be put together by selecting New Plan from the File menu bar option of the Steady Flow Analysis window. Once a Plan Title and Short Identifier (Short ID) have been entered, the modeler can select a Flow Regime for which the model will perform calculations. Subcritical, Supercritical, or Mixed flow regime calculations are available.
Additional features are available under the Options menu for: performing a Floodway Encroachment Analysis; Setting locations for calculating flow distribution output; conveyance calculation options; friction slope methods; calculation tolerances; critical depth output; critical depth computation method; split flow optimization; data checking; setting log file levels; and viewing the log file output.
Once the modeler has selected a Plan and set all of the calculation options, the steady flow calculations can be performed by pressing the Compute button at the bottom of the Steady Flow Analysis window. When this button is pressed, the HEC-RAS system packages up all the data for the selected plan and writes it to a run file. The system then runs the steady flow model and passes it the name of the run file. This process is executed in a separate window. Therefore, the modeler can work on other tasks while it is executing.
Viewing and Printing Results
Once the model has finished all of the computations, the modeler can begin viewing the results. Several output features are available under the View option from the main window. These options include: cross section plots; water surface profile plots; general profile plots; rating curve plots; 3D perspective plots; hydrograph plots and hydraulic property tables (if unsteady flow simulation was performed); tabular output at specific locations (Detailed Output Tables); tabular output for many locations (Profile Summary Tables); summary of errors, warnings, and notes; and viewing data contained in HEC-DSS.
An example of a cross section plot is shown in the figure below. The user can plot any cross section by simply selecting the appropriate River, Reach and River Station from the list boxes at the top of the plot. The user can also step through the plots by using the up and down arrow buttons. Several plotting features are available under the Options menu of the Cross-Section plot. These options include: zoom in; zoom out; full plot; pan; animate; selecting which plans, profiles and variables to plot; velocity distribution; viewing interpolated cross-sections; and control over the lines, symbols, labels, scaling, and grid options.
Hard copy outputs of the graphics can be accomplished in two different ways. Graphical plots can be sent directly from HEC-RAS to whichever printer or plotter the user has defined under the Windows Print Manager. Graphical plots can also be sent to the Windows clipboard. Once the plot is in the clipboard it can then be pasted into other programs, such as a word processor. Both of these options are available from the File menu on the various plot windows.
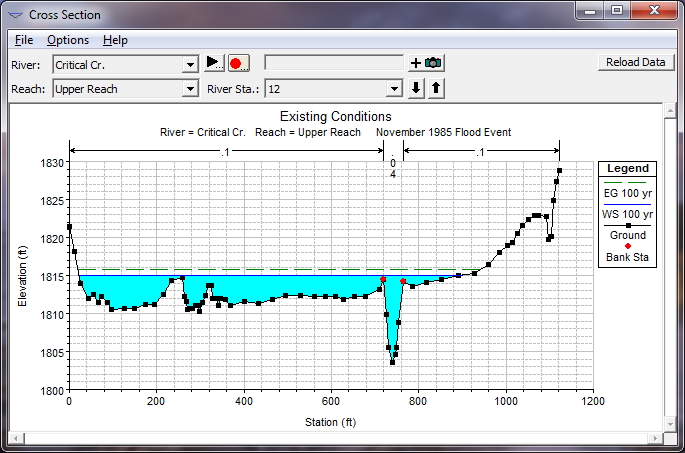
Cross Section Plot
An example of a profile plot is shown in the figure below. All of the options available in the cross-section plot are also available in the profile plot. Additionally, the user can select which specific reaches to plot when a multiple-reach river system is being modeled. 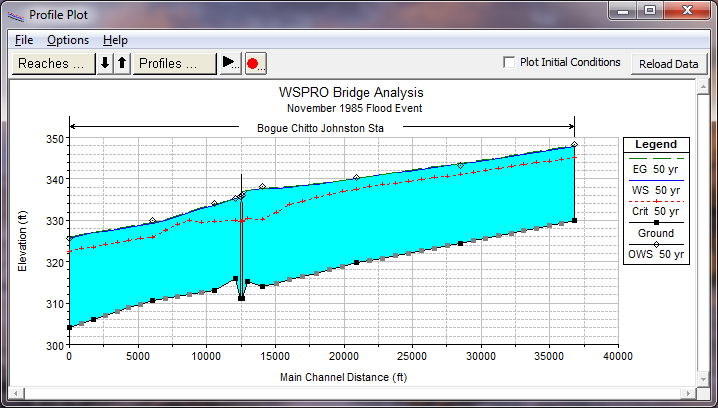
Profile Plot
An example of an 3D Perspective Plot of terrain and water depth is shown in in the figure below. The user has the option to display depth, water surface, velocity, etc. Additionally, the velocity tracers can be turned on in the 3D view. User's can control movement through the 3D space, as well as create predefined flight paths, and then have the software fly through the area along the flight path automatically. To learn more about the 3D viewer, go to Chapter 8, Viewing Results in this manual. 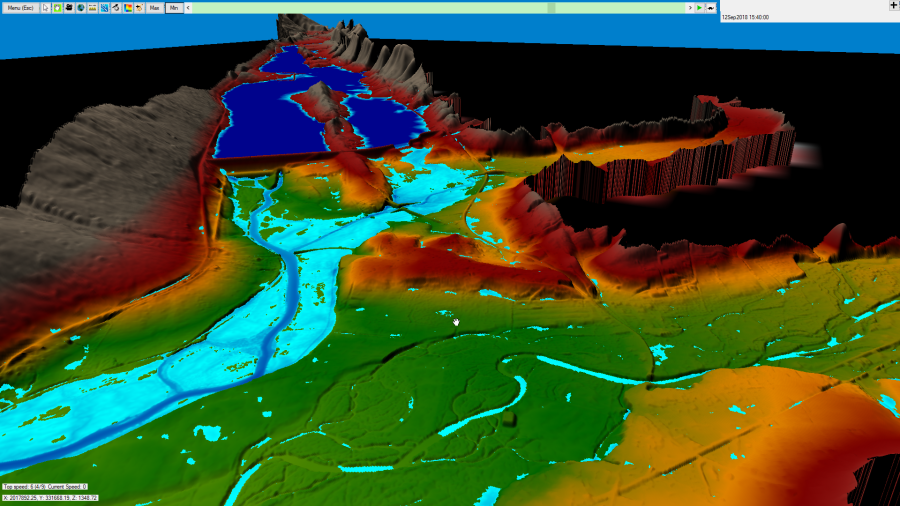
3D Perspective Plot of the Terrain and Water Depth.
Tabular output is available in two different formats. The first type of tabular output provides detailed hydraulic results at a specific cross section location (Detailed Output Table). An example of this type of tabular output is shown in below. 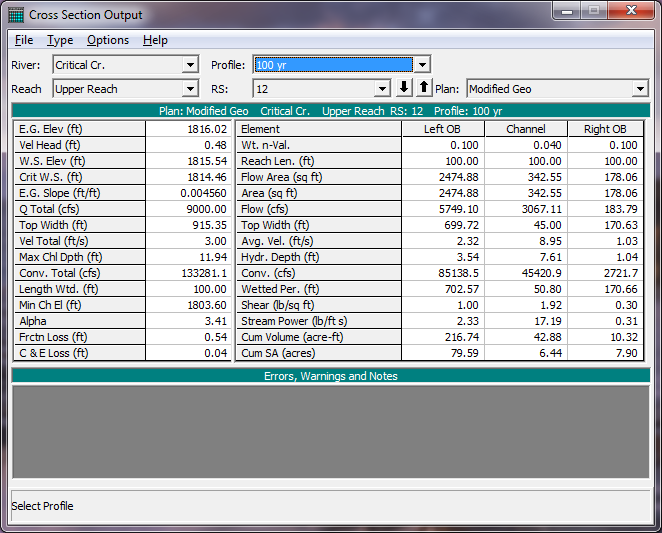
Tabular Detailed Output
The second type of tabular output shows a limited number of hydraulic variables for several cross sections and multiple profiles (Profile Summary Tables). An example of this type of tabular output is shown in in the figure below. There are several standard tables that are predefined and provided to the user under the Tables menu from the profile output tables. Users can also define their own tables by specifying what variables they would like to have in a table. User specified table headings can be saved and then selected later as one of the standard tables available to the project.
Tabular output can be sent directly to the printer or passed through the clipboard in the same manner as the graphical output described previously. This option is also available under the File menu on each of the table forms.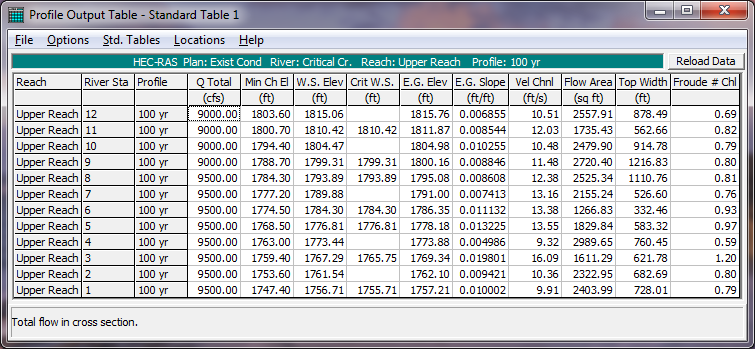
Profile Output Table
Getting and Using Help
On-line help is available from within the HEC-RAS software. Help can be accessed by selecting the Help menu option at the top of each window, or by pressing the F1 function key at any time. The help system is context sensitive, so when the F1 key is pressed, help will come up for the currently active HEC-RAS window.