There are two main reasons scientist and engineers develop sediment rating curves. One is to develop a flux boundary condition for a sediment transport model (like 1D or 2D mobile-bed HEC-RAS). But the other main reason to develop a sediment rating curve is to compute a term for a sediment budget. Sediment budgets are usually computed in terms of average annual load. Computing the average annual load requires analysts to 1) compute a sediment rating curve, 2) convert a flow time series (hydrograph) into a load time series (sedigraph) and 3) annualize that time series into a tons/year term.
When the Rating Curve Calculator downloads data from a USGS gage, it can now do all of those steps automatically. The Time Series tab of the Rating Curve Calculator will download all the flow data associated with the sediment gage, apply the user specified rating curve to compute sediment loads for each flow, and compute an average annual load.
Downloading Flow Data from the USGS
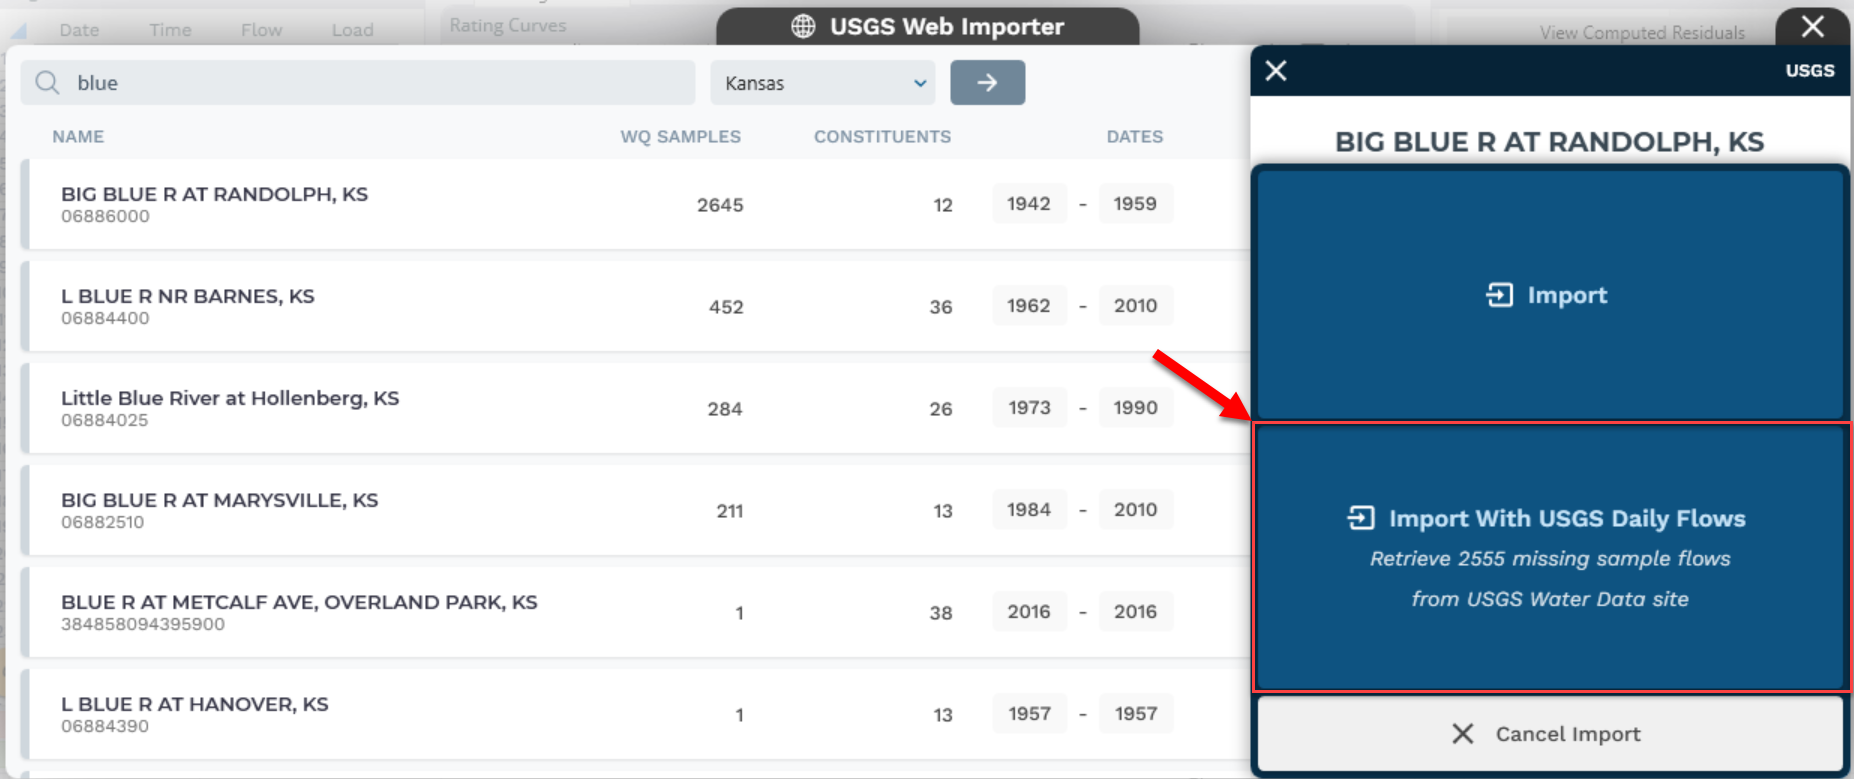
The US Geological Survey serves flow data from a different API than the sediment data. The Rating Curve Calculator already downloads these data to fill in flows for sediment samples that are not paired with flows. In the future, the tool will download these data automatically, but for now, in order to develop the sediment time series, always press the bottom button when importing the sediment data that says Import With USGS Daily Flows.
Wish List: Import Flows From Other Sources
This feature is not currently available for non-USGS analyses. The Rating Curve Calculator can import sediment data from csv files (or pasted from excel) but it can not import flows from either of those sources yet, making this feature temporarily unavailable.
Viewing your Sedigraph
Make the choices in the rating curve calculator that you think are appropriate to develop your flow-load or flow-concentration relationship. The tool will automatically use the active choices in the rating curve Controls to convert flows to sediment load. The Sedigraph should update as you change the rating curve assumptions. Press the Time Series tab to view the Sedigraph with the hydrograph.
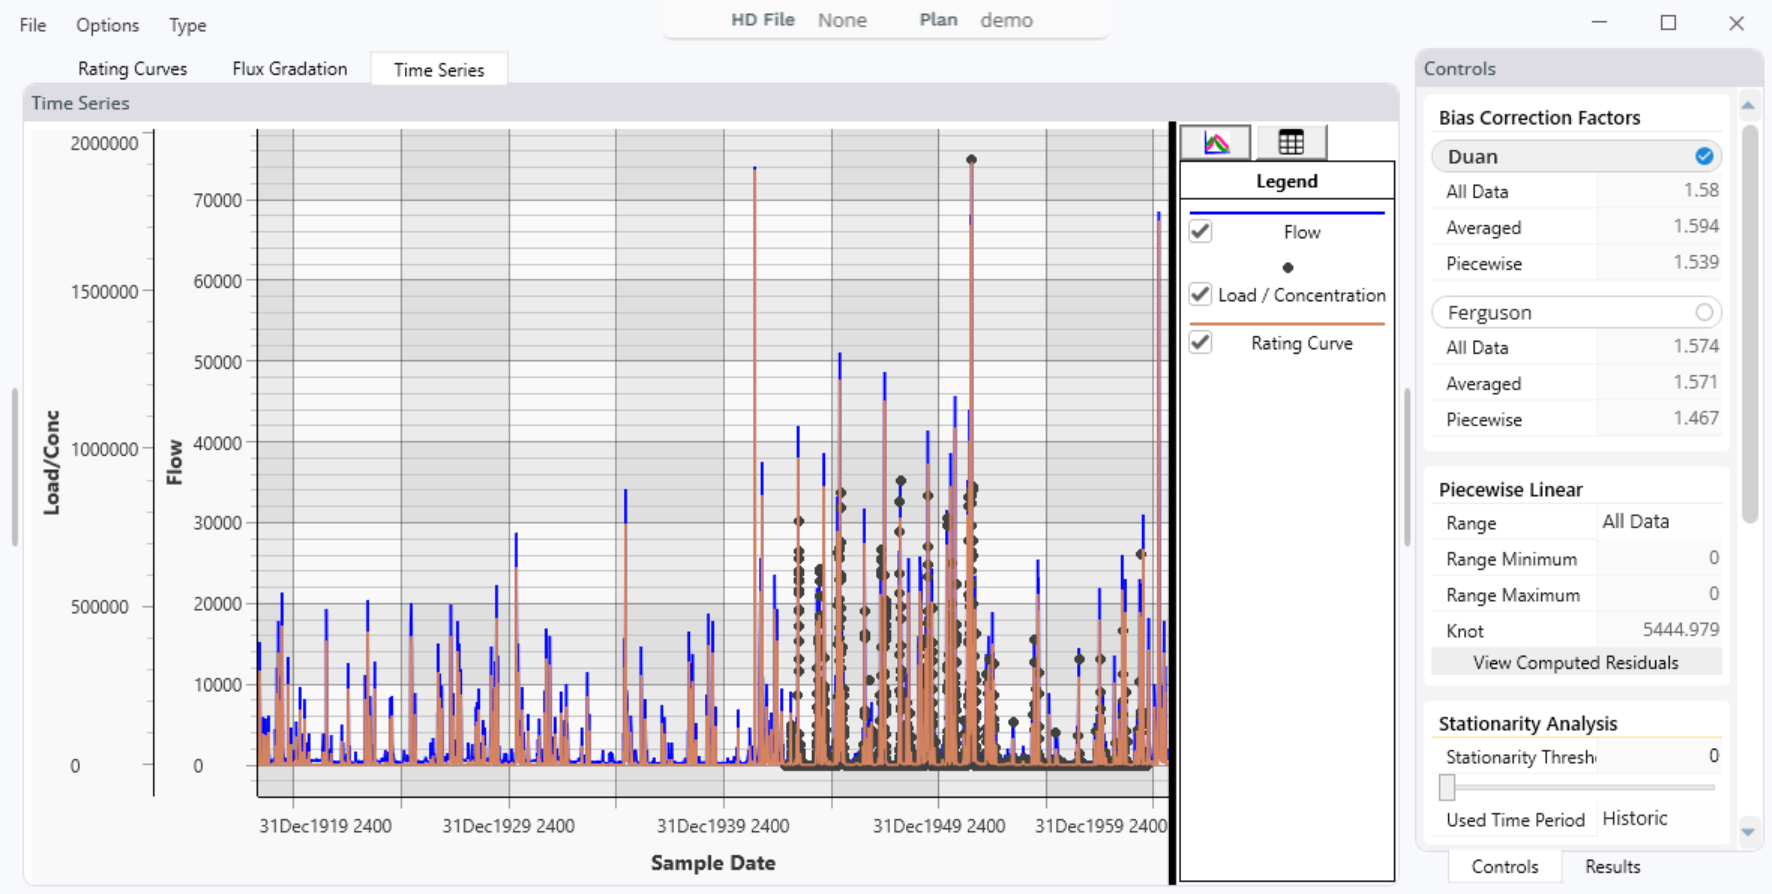
In the figure above, the blue line is the flow hydrograph, the brown line is the sedigraph (sediment time series) computed based on the rating curve decisions represented in the Controls (e.g. Duan bias correction and a Piecewise Linear regression for all data). The black points are actual sediment measurements (from the rating curve) plotted as a time series with the computed sedigraph.
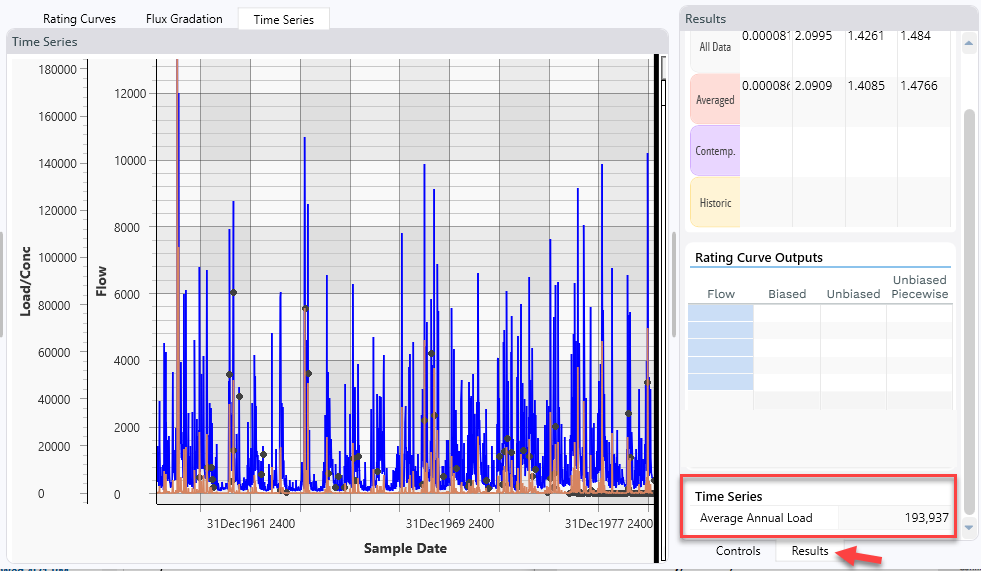
Computing Average Annual Load
The tool automatically computes the Average Annual Load and updates it based on new rating curve decisions. the Tool reports this number on the Results tab.