Download PDF
Download page Graphical Cross Section Editor.
Graphical Cross Section Editor
A graphical cross section editor is available from the Tools menu of the Geometric Data Editor window. When this option is selected, a window will appear as shown in Figure 5-84.
The user has the option to move objects (objects are ground points, main channel bank stations, Manning's n value station locations, ineffective flow areas, levees, and blocked obstructions), delete objects, or add new objects. To move an object, the user first selects Move Objects from the Options menu. Then move the mouse pointer over the object that you want to move, press down the left mouse button, and then move the object. When you are finished moving the object, simply release the left mouse button and the object will be moved. To delete an object, first select Delete Objects from the Options menu. Next, move the mouse pointer over the object that you would like to delete and click the left mouse button. Whatever object is closest to the mouse pointer will be deleted. To add an object to the cross section, first select the type of object you want to add from the available list under the Options menu. Once you have selected an object type to add, move the mouse pointer to the location where you would like to add it and click the left mouse button. If the object that you are adding requires more than one point, such as blocked ineffective flow areas and blocked obstructions then continue to move the mouse pointer and click the left mouse button to add the additional points.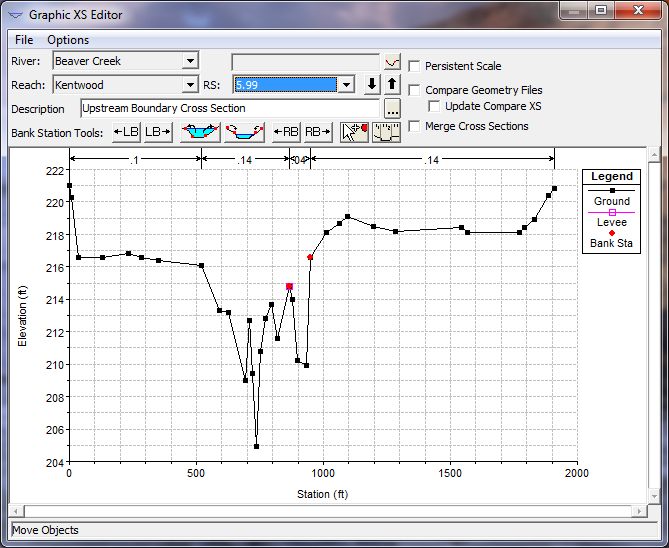
Figure 5 84. Graphical Cross Section Editor
Other available options from the Graphical Cross Section editor are the ability to zoom in and zoom out, full plot, pan, overlay a grid onto the cross section plot, and to undo all of the graphical editing. When the Undo Edits option is selected, the cross section is automatically returned to its original state before this particular editing session began. However, once this editor is closed, or if the user selects a different cross section from the editor, it is assumed that the user is happy with the changes that were made and they are saved in memory. The data is not saved to the hard disk, so it is still possible to get the original data back if needed.
Bank Station Tools
Several tools have been added to make it convenient to change the location of the main channel bank stations. These tools are in the form of buttons across the top of the graphic window displaying the currently opened cross section.
| Tool | Description |
|---|---|
| Allows the user to move the left bank of the main channel one point at a time to the left. Simply click this button to have the left main channel bank station move one point to the left. |
| Allows the user to move the left bank of the main channel one point at a time to the right. Simply click this button to have the left main channel bank station move one point to the right. |
| Allows the user to move the main channel bank stations to cross section points that are just above the currently displayed water surface profile. The user can turn on any of the previously computed water surface profiles to be displayed on the plot. Once a water surface profile is displayed, and the user presses this button, the main channel bank stations will be move to the first two points that are above the water line on the plot. This option is very useful if you would like to set the main channel bank stations to a consistent stationing based on a particular flow event. For example, if a water surface profile is computed for the 2-year flow event, the user could then move all of the main channel bank stations just outside of this flow profile. |
| This tool is very similar to the previously described tool. It does the same thing, only moving the main channel bank stations inward to just above the water line (assuming the current main channel bank stations are above the water line). |
| Allows the user to move the right bank of the main channel one point at a time to the left. Simply click this button to have the right main channel bank station move one point to the left. |
| Allows the user to move the right bank of the main channel one point at a time to the right. Simply click this button to have the right main channel bank station move one point to the right. |
| Allows the user to set the left or right bank of the main channel to a stationing of one of the existing points in the cross section. Once this button is pressed, the user can set the stationing of the left and right bank of the main channel by simply moving the mouse to the desired location and clicking the left mouse button. The program assumes the left bank when the mouse is left of the lowest point in the view area, and it assumes the right bank when the mouse pointer is right of the lowest point in the view area. |
| Allows the user to move the station locations of existing Manning's n values. When this option is selected, vertical lines will appear at all of the current Manning's n value (or K-value) break points. The user can move the mouse pointer over the n value break locations at the top of the graphic, press and hold the left mouse button down, and then move the n value break location to the new desired location. |
Persistent Scale
This option allows the user to set a persistent scale, in both the vertical and horizontal, to be used when plotting any cross section. When this option is checked, additional data fields will be displayed to the right of the option. The user has the option to set a left and right stationing, or a maximum width for the X-axis. Likewise, a top and bottom elevation, or a height can be set for the Y-axis. By setting a persistent scale, as the user moves from one cross section to the next, it is much easier to visualize how cross sections are changing from one to the next.
Compare Geometry Files
This option allows the user to compare cross sections from two different geometry files (one being the currently opened geometry file). When this option is selected, additional data fields and buttons will show up to the right of this option. The user first selects the second geometry file to use for comparing to the currently opened geometry file. Next the user selects the specific river, reach, and river stationing to plot against the currently displayed cross section. The second geometry, which will be displayed in pink on the graphic, is only for visualization, as it cannot be modified by the graphical editor.
Merge Cross Sections
This option allows the user to merged data from one cross section into another. This option works in conjunction with the Compare Geometry Files option described above. To use this option, the user must first turn on the compare geometry files option and select the desired geometry file and cross section to compare to the current geometry file and cross section. Next the user turns on the Merge Cross Sections option. When this option is selected some additional data fields will show up next to the Compare Geometry Files data fields. Additionally two red vertical lines will show up on the plot, defaulted to the main channel bank stations of the existing cross section. An example of what the Graphical Cross Section editor will look like when the two options are turned on is shown in the figure below.
Figure 5 85. Graphical Cross Section Editor with Merge Cross Section Option.
As shown in the Figure above, the two red lines indicate the zone for merging data. The merge data zone can be everything inside of the two lines, or everything outside the two lines. The merge data zone can be changed by either graphically grabbing one of the vertical lines or moving it, or by entering a value in the appropriate fields under the Merge XS data area at the upper right hand corner of the window. Before the data is merged, the user may want to shift the comparison cross section (shown in purple) left or right, and/or up and down, to align the appropriate portion of the cross section with the appropriate portion of the current cross section (shown in black). Shifting the comparison cross section can be accomplished by entering a Shift X and/or Shift Y value into the appropriate fields in the upper right corner of the window. Additionally the cross section can be shifted by holding down the Shift key and then pressing the arrow keys. The amount of shift for each press of an arrow key can be controlled by entering a value for the X and Y shift amount in the fields in the upper right corner of the window. Once the merge zone has been set, and the comparison cross section has been shifted appropriately, the user can press either the button labeled Inside or Outside. If the button labeled Inside is pressed, then the data for the current cross section, inside of the merge zone (between the two red lines), is replaced with the data from the comparison cross section. If the button labeled Outside is pressed, then the data outside of the two red lines is replaced (i.e. the data from the current cross section, outside of the red lines, is replaced with the data from the comparison cross section.