Download PDF
Download page Flow Hydrograph Optimization.
Flow Hydrograph Optimization
Flow Hydrograph Optimization in HEC-RAS is an automated tool that allows the user to specify a Reference Location for the model to monitor either Stage or Flow and perform adjustment to the inflow hydrographs to hit a Target Value specified by the user. This option may to be used to identify flow requirements by scaling a predefined hydrograph (or set of hydrographs) by a specified Flow Ratio for flows coming into a reservoir or in a river at a levee location in order to bring the stage up to a specific height (to breach a structure or keep water from over-topping).
The Flow Hydrograph Optimization procedure is available for both 1D and 2D unsteady flow models. In order to successfully use the capability, you must have a stable unsteady flow model that has been tested for the range of flows the model may need to run. As the complexity of the model increases with things such as over-topping high ground, spillage into the floodplain, gates adjusting, etc. the successful completion flow hydrograph optimization will decrease.
Data Entry
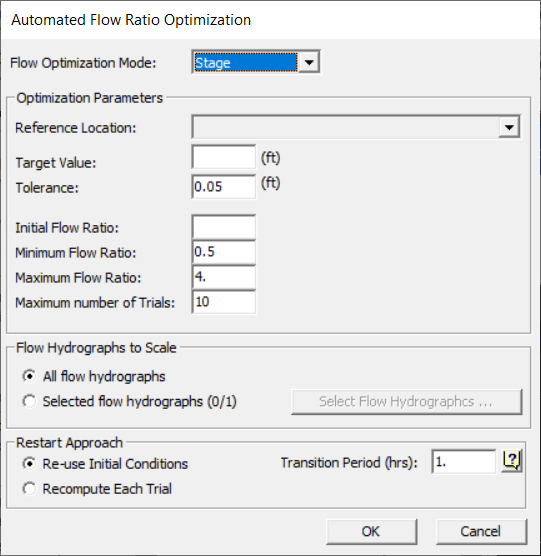
The Flow Hydrograph Optimization capability is accessible from the Unsteady Flow Analysis window from the Options | Automated Flow Optimization menu item. The Automated Flow Ratio Optimization window (shown below) is available for both 1D and 2D Unsteady Flow simulations. In order to used the hydrograph optimization tools, you must first create a Reference Location for the Geometry of interest (this can be done in RAS Mapper or the Geometric Data Editor). A Reference Point can be used to specify a reference stage, while a Reference Line is used to specify a reference flow.
Once a Flow Optimization Mode is specified (Stage or Flow), the user will specify the Reference Location (previously created), and the Target Value (Stage or Flow). There are various optimization parameters; however, the you must specify an Initial Flow Ratio for the first Trial.
| Parameter | Description |
|---|---|
| Flow Optimization Mode | Specifies which flow optimization mode to use (None, Flow, Stage). Choose None to turn off optimization. |
| Reference Location | Reference location to optimize. The user then selects a reference location that was previously created.
|
| Target Value | The value to optimize to. |
| Tolerance | The tolerance for optimization to the Target Value. |
| Initial Flow Ratio | Flow ratio to use for the 1st Trail. (A value of 1.0 would use the existing flow data a specified) |
| Minimum Flow Ratio | Minimum value the optimization will attempt to use during a Trial. |
| Maximum Flow Ratio | Maximum value the optimization will attempt to use during a Trial. |
| Maximum number of Trials | Maximum number of Trials to be used to attempt to satisfy the Target Value. |
| Flow Hydrographs to Scale | A specification of which flow hydrographs will be adjusted to the optimization trials. |
| Restart Approach | The restart approach is used to satisfy the initial conditions of the unsteady flow simulation.
|
| Transition Period | This is the time period (in hours) used to transition from the initial conditions (from the base hydrograph) to the scaled hydrograph. |
Optimization Procedure
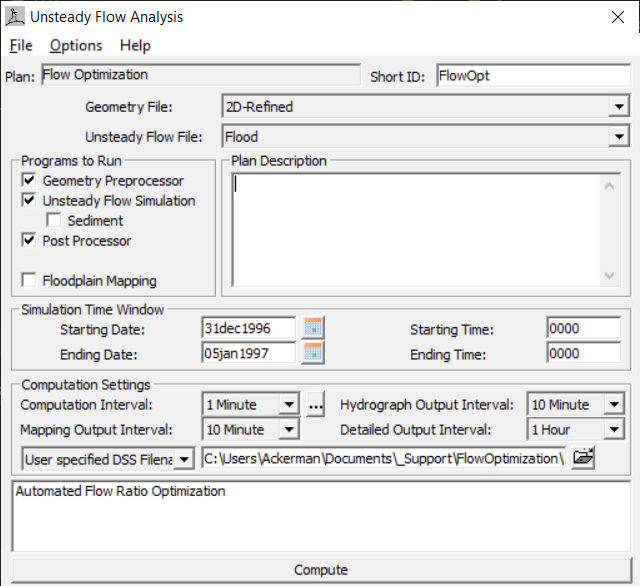
Once optimization information has been entered, the Unsteady Flow Analysis window will indicate Automated Flow Ratio Optimization will be utilized (at the bottom of the window) during the simulation.
The first Trial simulation will run using the Initial Flow Ratio to scale the base hydrograph. (If you aren't sure how the model will perform, you could use a value of 1.0; however, you may already know which way you should scale the hydrograph to achieve the desired results.) After the first Trial, the Computed result (stage or flow) will be compared with the desired Target value and reported with the runtime messaging. ![]()
Based on the Difference (Computed - Target), the flow optimization will vary the Flow Ratio and re-run the next Trial simulation.
During simulation, the runtime messages will inform the user that Flow Optimization has been turned on and echo the Target value and Reference Location. As the Trials progress, the user is informed of progress and the final, optimized Hydrograph Ratio will be written to the messages.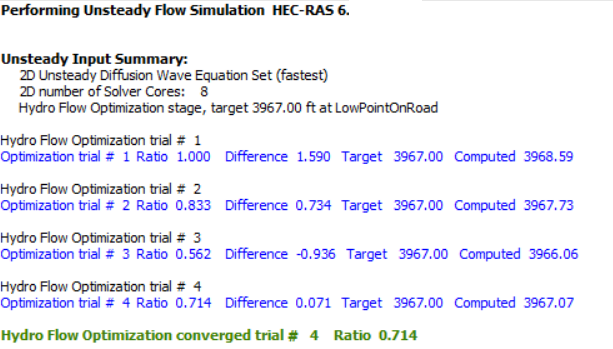
If the Hydrograph Flow Optimization is not able to converge with the given optimization parameters (Min Flow Ratio, Max Flow Ratio, or Number of Trials), the user will be informed of the failed convergence.![]()
Depending on model complexity and model stability, there is a possibility that the unsteady flow simulation will iterate (more than expected) and may even go unstable. If the simulation goes unstable, RAS will stop running new Trials.
Viewing Results
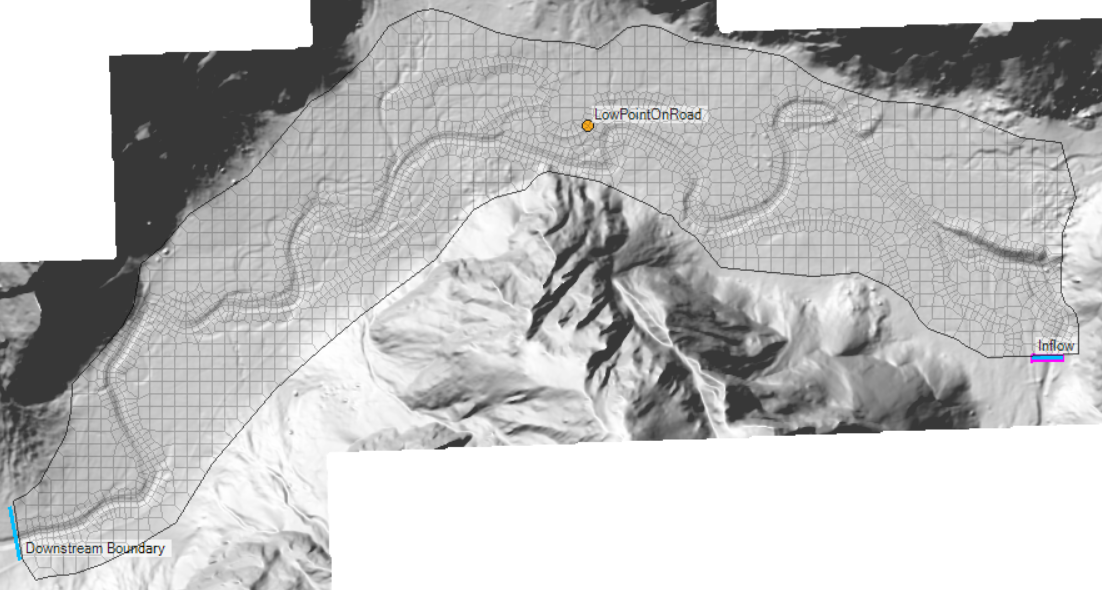
All of the normal plots and maps are available for data analysis for evaluating the floodplain water surface elevations, depths and velocities. A Flow Optimization layer is added to the results group for the identified plan under the Plan node. This will allow a user to visualize the Reference Location used and the Boundary Conditions of the model. The boundary conditions used for the hydrograph optimization will be highlighted with the highlight color. (Note, the Flow Optimization layer is an aggregate of multiple layers and will use the base symbology for each layer.)
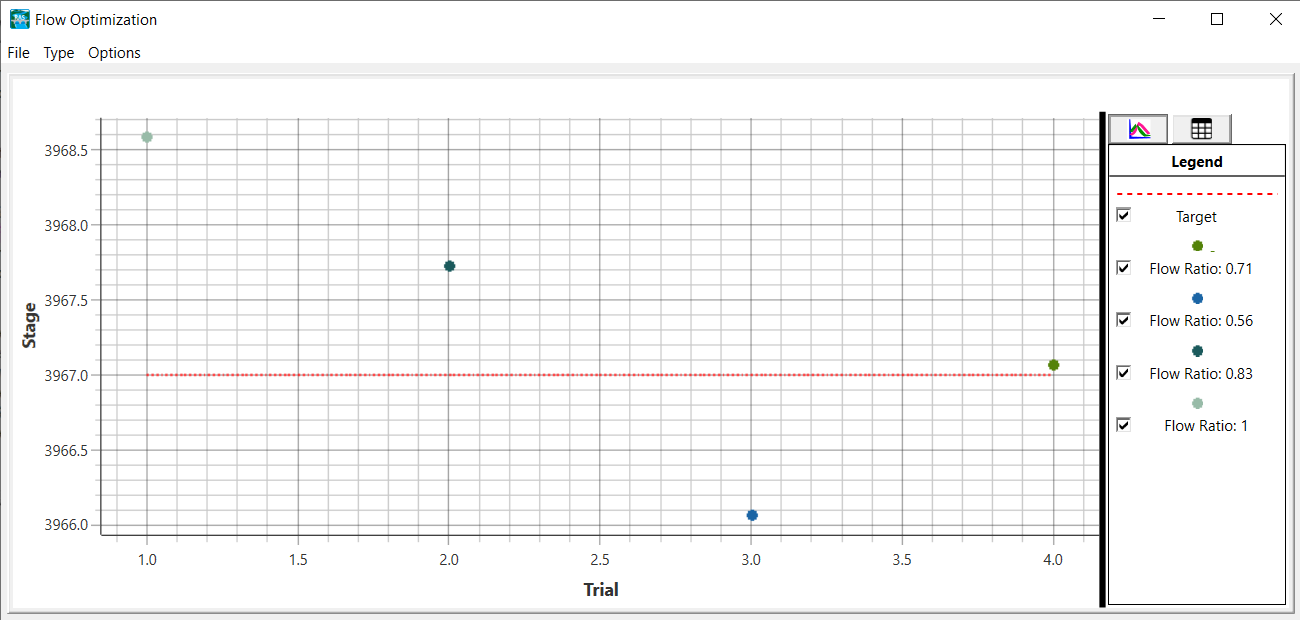
Flow Hydrograph Optimization results are available by right clicking on the Plan name and choosing View Flow Optimization Plot, shown below. The Flow Optimization Plot will indicate the desired Target value and the Flow Ratio used for each Trial.